—
title: “Datadog Alternatives for Observability: SigNoz vs Grafana Cloud vs New Relic vs Better Stack (2026)”
slug: datadog-alternatives-observability-2026-en
category: comparisons
language: en
focus_keyword: Datadog alternatives
seo_title: “Best Datadog Alternatives 2026: Open Source vs Commercial Observability”
seo_description: “Deep comparison of SigNoz, Grafana Cloud, New Relic, Better Stack as Datadog alternatives. Pricing, features, migration paths analyzed for engineering teams.”
—
Datadog Is Expensive. Are the Alternatives Actually Good Enough?
Run 50 hosts on Datadog Infrastructure Pro plus APM and your monthly bill clears $2,300 before you even add logs or Synthetics. The per-host pricing stacked across individual products means a single autoscale spike can blow your entire monthly budget. Add custom metrics at $0.05 each, log ingestion at $0.10/GB after a tiny included quota, and Synthetics API checks at $5/10K runs — costs compound fast once you actually use the platform.
In 2026, both open-source and newer commercial platforms have matured enough to give small and mid-size engineering teams a real exit from the Datadog pricing trap. The question isn’t whether alternatives exist. It’s whether they can match the depth and reliability you need in production.
We tested four leading alternatives across eight dimensions. Here’s what the numbers actually look like.
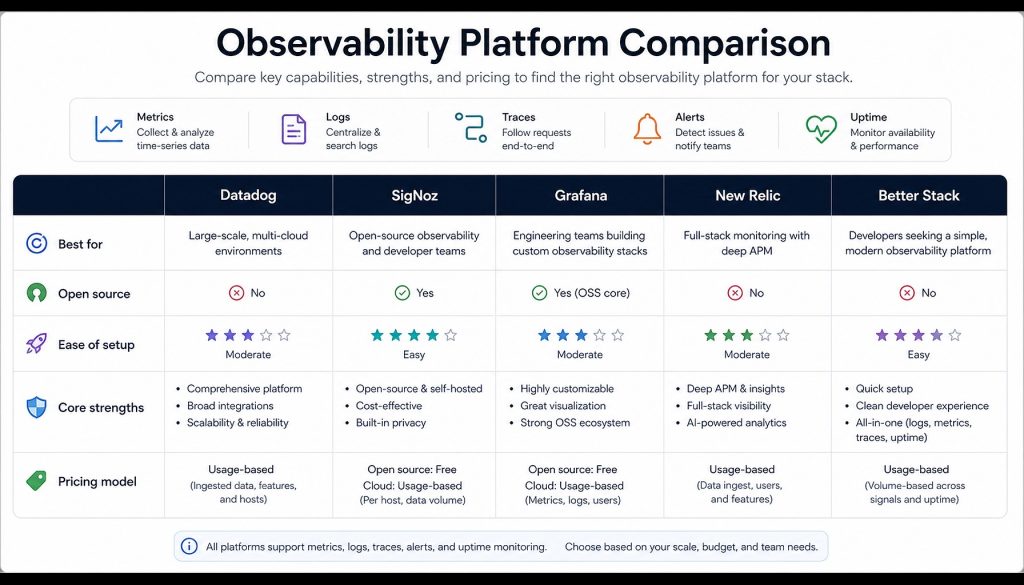
Head-to-Head Comparison Table
| Dimension | SigNoz | Grafana Cloud | New Relic | Better Stack |
|---|---|---|---|---|
| Pricing Model | Self-hosted free; Cloud starts at $199/mo base + $0.30/GB logs & traces, $0.10/M metric samples | Free tier: 10K metric series + 50GB logs + 50GB traces; Pro $19/user/mo + usage fees | Free 100GB/mo ingestion; overage $0.40/GB; Full Platform seat $349/user/mo (annual) | Free tier: 3GB logs + 10 monitors; Responder $29/user/mo (annual); logs €0.10/GB ingestion (EU) |
| Deployment | Self-hosted (Docker/K8s) or SigNoz Cloud | Fully managed SaaS; open-source stack (Mimir + Loki + Tempo) available for self-hosting | Fully managed SaaS | Fully managed SaaS (EU, US-East, US-West, Singapore nodes) |
| Feature Completeness | APM + Logs + Traces + Metrics + Alerts + Exception Tracking; OpenTelemetry-native | Metrics (Mimir) + Logs (Loki) + Traces (Tempo) + Profiling (Pyroscope) + k6 load testing | APM + Logs + Metrics + Browser RUM + Mobile + AI Troubleshooting + Synthetics; 50+ capabilities | Logs + Uptime Monitoring + Traces + Metrics + Error Tracking + Status Pages + On-call Management |
| Learning Curve | Medium: self-hosting requires K8s ops experience; UI is intuitive, OTel SDK onboarding is standardized | Steep: multi-component assembly (Prometheus + Loki + Tempo), fragmented configuration | Low: works out of the box, one-click agent install, AI-guided troubleshooting | Low: clean product design, SQL-based log queries, 5-minute setup |
| Integration Ecosystem | OpenTelemetry-native; supports all OTel SDK languages; ClickHouse storage enables direct SQL queries | 700+ data sources; full Prometheus community coverage; mature Terraform provider | 400+ integrations; flexible NRQL query language; deep Kubernetes, AWS, Azure connectors | 100+ integrations; Terraform provider; imports Datadog/Grafana dashboards; AI SRE agent |
| Data Retention | Self-hosted: unlimited (disk-bound); Cloud default 15 days, extendable | Free tier 14 days; Pro pay-per-use extends up to 13 months | Standard 8 days; Data Plus $0.60/GB extends to 90 days | Free tier 3 days; paid 30 days+; supports archiving to your own S3 |
| Alerting | Built-in multi-condition alerts + notification channels (Slack/PagerDuty/Webhook) | Grafana Alerting unified rule engine; supports cross-datasource composite alerts | AI-driven anomaly detection + Errors Inbox + workflow automation | Anomaly detection alerts + unlimited phone/SMS notifications + on-call scheduling + auto-escalation |
| Community & Support | 18K+ GitHub stars; active Slack community; core team participates directly | Grafana Labs-led; largest open-source monitoring community globally; extensive Stack Overflow coverage | Enterprise SLA support (Pro 2h / Enterprise 1h response); active community forum | Czech company, fast response; 60-day money-back guarantee; clear docs but smaller community |
Deep Dive: Each Alternative
SigNoz — The Best Pick for Open-Source Teams
SigNoz is a full-stack open-source observability platform built on ClickHouse, with native OpenTelemetry support. The self-hosted Community edition is completely free — no data caps, no user limits.
Real-world pricing: 20 hosts generating 50GB of logs per day? Self-hosted costs you 3–4 ClickHouse nodes (roughly $200–400/month in server costs). On SigNoz Cloud at $0.30/GB, that same 50GB/day runs about $450/month — around 60% cheaper than equivalent Datadog coverage.
What works well: Single platform covers APM, logs, traces, and metrics without stitching components together. ClickHouse delivers brutal query performance on both full-text search and high-cardinality dimensions. The built-in Datadog migration tool batch-converts dashboards automatically.
Where it falls short: Self-hosting means your team owns ClickHouse maintenance. Small teams without dedicated SREs will feel the weight. Cloud data centers are in the US and India, so latency may be a concern for Asia-Pacific teams. The integration catalog is smaller than legacy vendors.
Best for: Engineering teams of 10–50 with Kubernetes ops capability who want data sovereignty and cost control. If your org already runs ClickHouse for analytics, SigNoz slots in with minimal new infrastructure. Start a free 30-day SigNoz Cloud trial.
Grafana Cloud — The Natural Upgrade for Prometheus Users
Grafana Cloud bundles Mimir (metrics), Loki (logs), Tempo (traces), and Pyroscope (continuous profiling) into a managed platform. The free tier includes 10,000 active metric series, 50GB logs, 50GB traces, and 3 user seats — enough for side projects and early-stage startups.
Real-world pricing: Pro runs $19/user/month plus usage fees (metrics at $6.50/1K series, log ingestion at $0.40/GB). A 5-person team monitoring 30 hosts lands somewhere around $300–500/month. But Grafana bills across 7+ dimensions, and real invoices frequently come in 2–5x higher than initial estimates.
What works well: The entire backend is open source (Mimir, Loki, Tempo). If you outgrow Cloud or disagree with pricing changes, you can self-host and migrate back. Existing Prometheus dashboards, alerting rules, and PromQL queries carry over directly. Visualization capabilities remain best-in-class.
Where it falls short: Multiple components mean fragmented configuration. Loki’s log querying isn’t as flexible as ClickHouse-based alternatives. Enterprise support has been slow — some users report 3-week waits for quotes.
Best for: Teams already running Prometheus + Grafana who want a managed upgrade path without re-learning anything. Platform engineering groups that need fine-grained visualization control will also appreciate Grafana’s unmatched dashboard flexibility. Activate Grafana Cloud free tier.
New Relic — The Enterprise Choice When Budget Isn’t the Constraint
New Relic restructured its pricing in 2020 to a data-ingestion-plus-seats model. The permanent free tier gives you 100GB/month ingestion and 1 Full Platform user — genuinely usable for lightweight monitoring on under 20 hosts.
Real-world pricing: Beyond the free allotment, overage costs $0.40/GB (standard) or $0.60/GB (Data Plus with 90-day retention). The expensive part is seats: Pro at $349/user/month (annual). Five Full Platform seats cost $1,745/month. The move: limit Full Platform seats to 5 power users, give everyone else free Basic seats, and your total stays in the $2,000–3,000 range for full-stack coverage.
What works well: Most complete feature set on this list — APM, browser RUM, mobile monitoring, Synthetics, AI-powered root cause analysis, all under one roof. NRQL is genuinely powerful for ad-hoc investigation. Install the agent and everything works. Zero infrastructure to manage.
Where it falls short: Seat pricing stings for mid-size teams. Standard data retention is only 8 days. Contracts auto-renew and cancellation is immediate (no prorated refunds). Occasional connectivity issues outside North America.
Best for: Engineering organizations of 50+ who need full-stack observability with AI-assisted troubleshooting and are willing to pay for zero operational burden. Also a strong choice for startups under 20 hosts that can live entirely within the free 100GB tier indefinitely. Sign up for New Relic’s permanent free tier.
Better Stack — European DNA, Privacy-First
Better Stack (Czech Republic) combines uptime monitoring, log management, tracing, on-call management, and status pages in a single product. The log engine also runs on ClickHouse with SQL query support.
Real-world pricing: Responder at $29/user/month (annual), EU log ingestion at €0.10/GB plus €0.05/GB/month storage. A 5-person team ingesting 100GB logs/month pays roughly $160/month. Pricing is transparent — no hidden billing dimensions.
What works well: European data residency by default means GDPR compliance without extra configuration. Product design is minimal and fast to learn. Built-in AI SRE agent automatically investigates root causes. Supports importing Datadog and Grafana dashboards. 60-day money-back guarantee lowers commitment risk.
Where it falls short: APM depth doesn’t match New Relic — code-level tracing is weaker. The community is small; you’re relying on official support. The Singapore node costs 3x more ($0.35/GB), eroding the cost advantage for Asia-Pacific teams.
Best for: Teams with European compliance requirements who prefer an all-in-one lightweight platform and don’t need deep APM instrumentation. Also worth considering if your primary use case is uptime monitoring plus log search — the combined pricing undercuts running separate tools. Activate Better Stack free tier.
Decision Framework
Budget under $500/month: SigNoz self-hosted is your strongest option if you have Kubernetes ops capability (total cost approaches zero). Otherwise, Grafana Cloud’s free tier gives you zero learning cost if you already run Prometheus. SigNoz Cloud Teams at $199/month is the managed sweet spot.
Enterprise requirements with budget flexibility: New Relic delivers the most hands-off experience. Keep Full Platform seats to 5 or fewer, assign Basic (free) seats to everyone else, and you get full-stack observability for $2,000–3,000/month.
European/privacy compliance is non-negotiable: Better Stack is the only option with European data residency by default. Logs stored on EU nodes at the lowest ingestion cost (€0.10/GB). Grafana Cloud offers EU regions too, but setup is more involved.
Already running Prometheus: Grafana Cloud is the seamless migration. Your PromQL, AlertRules, and Dashboard JSON all transfer directly — no changes to collection agents needed.
Migrating Away from Datadog: Key Steps
1. Data export: Datadog has no native export feature, but you can pull recent metrics and logs via API. SigNoz provides an automated migration tool that translates Datadog dashboards into SigNoz format directly. Better Stack and Grafana both support importing Datadog Dashboard JSON.
2. Agent swap: Replace the Datadog Agent with OpenTelemetry Collector (native for SigNoz and Grafana Tempo) or the target platform’s agent (New Relic Agent, Better Stack’s Vector integration). Run both in parallel on staging for 1–2 weeks to validate data completeness.
3. Dashboard rebuild: Migration tools handle roughly 80% of panel conversion automatically. The remaining 20% needs manual query syntax adjustment — Datadog’s query language differs significantly from PromQL, NRQL, and SQL. Budget 1–2 sprint cycles for this work.
4. Alert migration: Export Datadog Monitor configurations → rewrite alert rules in the new platform’s syntax → run old and new alerts in parallel for one week → confirm no missed alerts before decommissioning Datadog.
The Bottom Line
In 2026, Datadog alternatives are no longer compromise picks. SigNoz’s open-source stack matches commercial platforms on performance and features. Grafana Cloud’s free tier costs small teams nothing. New Relic’s free ingestion makes lightweight usage permanently free. Better Stack carves out a real niche with European compliance and clean design.
The migration path matters as much as the destination. Whichever platform you choose, plan for a 2–4 week parallel-run period where both systems ingest the same data. This catches gaps in coverage, query parity issues, and alerting blind spots before you cut over completely.
No single platform is perfect. But you no longer have to be held hostage by Datadog’s billing model. Pick the one that matches your team’s ops maturity, compliance needs, and budget constraints — then commit to the migration. The savings compound every month you delay.
Stay updated with our latest AI insights