Datadog Is Expensive. Can the Alternatives Actually Replace It?
Run 50 hosts on Datadog Infrastructure Pro plus APM and you’re looking at $2,300/month before you even add logs or Synthetics. The per-host pricing model punishes autoscaling: one traffic spike can blow through your monthly budget in hours. The good news is that in 2026, open-source and newer commercial platforms have matured enough to offer real competition. Below is a head-to-head comparison of four alternatives, with actual pricing math, migration considerations, and a decision framework to help you pick.
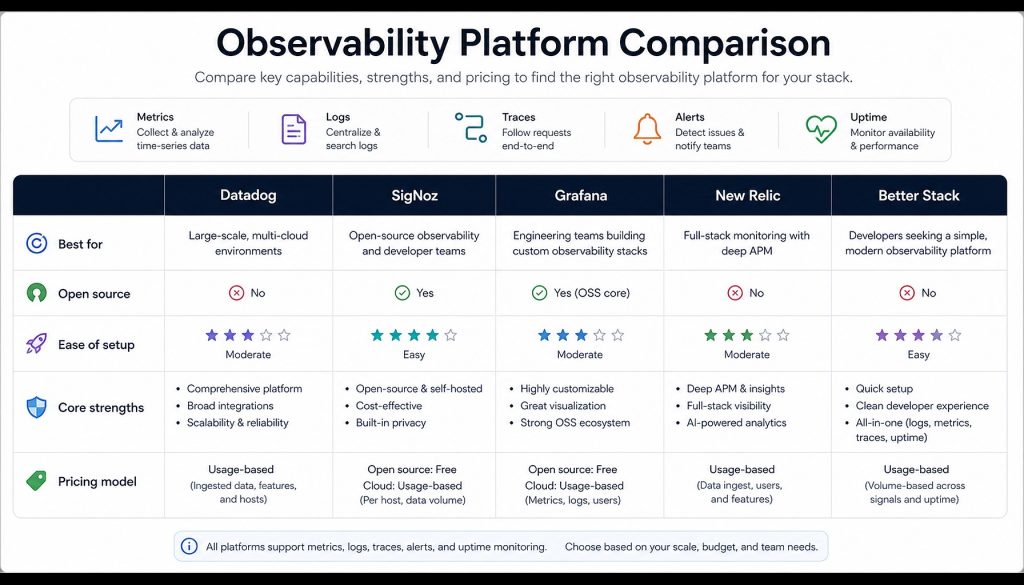
Feature and Pricing Comparison
| Dimension | SigNoz | Grafana Cloud | New Relic | Better Stack |
|---|---|---|---|---|
| Pricing model | Self-hosted: free. Cloud: $0.30/GB logs+traces, $0.10/million metric samples, starting at $199/mo | Free tier: 10K metric series + 50GB logs + 50GB traces. Pro: $19/user/mo + usage fees | Free 100GB/mo ingest. Overage: $0.40/GB. Full Platform seat: $349/user/mo (annual) | Free tier: 3GB logs + 10 monitors. Responder: $29/user/mo (annual). Logs: EUR 0.10/GB ingest (EU region) |
| Deployment | Self-hosted (Docker/K8s) or SigNoz Cloud | Fully managed SaaS. Underlying stack is open source (Mimir + Loki + Tempo) for self-hosting | Fully managed SaaS | Fully managed SaaS (EU/US East/US West/Singapore regions) |
| Feature coverage | APM + logs + traces + metrics + alerting + error tracking. OpenTelemetry native | Metrics (Mimir) + logs (Loki) + traces (Tempo) + profiling (Pyroscope) + k6 load testing | APM + logs + metrics + browser RUM + mobile + AI troubleshooting + Synthetics. 50+ capabilities | Logs + uptime monitoring + traces + metrics + error tracking + status pages + on-call management |
| Learning curve | Medium. Self-hosted requires K8s ops experience. UI is straightforward, OTel SDK onboarding is standardized | Steep. Multiple components to configure (Prometheus + Loki + Tempo). Config is scattered across services | Low. Agent installs in minutes. AI-guided troubleshooting walks you through issues | Low. Clean product design, SQL-based log queries, up and running in 5 minutes |
| Integrations | OpenTelemetry native, supports all OTel SDK languages. ClickHouse storage allows direct SQL queries | 700+ data sources. Full Prometheus community coverage. Mature Terraform provider | 400+ integrations. Flexible NRQL query language. Deep Kubernetes, AWS, Azure support | 100+ integrations. Terraform provider. Import Datadog/Grafana dashboards. AI SRE agent |
| Data retention | Self-hosted: unlimited (disk-bound). Cloud: 15 days default, extendable | Free tier: 14 days. Pro: pay-per-use up to 13 months | Standard: 8 days. Data Plus ($0.60/GB) extends to 90 days | Free tier: 3 days. Paid: 30 days minimum. Archive to your own S3 |
| Alerting | Built-in multi-condition alerts + notification channels (Slack/PagerDuty/Webhook) | Grafana Alerting unified rules engine. Cross-datasource alerts | AI-driven anomaly detection + Errors Inbox + workflow automation | Anomaly detection + unlimited phone/SMS notifications + on-call scheduling + auto-escalation |
| Community/support | 18K+ GitHub stars. Active Slack community. Team participates directly | Grafana Labs-led. Largest open-source monitoring community. Massive Stack Overflow presence | Enterprise SLA (Pro: 2h / Enterprise: 1h response). Active community forum | Czech company, fast response times. 60-day refund guarantee. Clear docs, smaller community |
SigNoz: The Best Open-Source Option
SigNoz is an open-source full-stack observability platform built by a team out of India. It uses ClickHouse for storage and supports OpenTelemetry natively. The self-hosted Community edition is completely free with no limits on data volume or user count.
What it costs in practice. 20 hosts generating 50GB of logs per day: self-hosted, you need 3-4 ClickHouse nodes (roughly $200-400/month in server costs). On SigNoz Cloud at $0.30/GB, that same 50GB/day runs about $450/month. Either way, you’re paying around 60% less than Datadog for the same workload.
Where it shines. A single platform covers APM, logs, traces, and metrics without stitching together separate tools. ClickHouse gives you fast full-text search and handles high-cardinality queries without breaking a sweat. There’s a built-in Datadog migration tool that converts dashboards automatically.
Where it falls short. Self-hosting means your team owns ClickHouse operations, and that’s a non-trivial ops burden for a small team. The Cloud offering has data centers in the US and India only, so latency can be a problem for teams in other regions. The integration catalog is thinner than what you get from established vendors.
Best fit: Engineering teams of 10-50 people with Kubernetes ops experience who want data sovereignty and are budget-conscious. Try SigNoz Cloud free for 30 days.
Grafana Cloud: The Natural Upgrade for Prometheus Users
Grafana Cloud is the managed service from Grafana Labs. It bundles Mimir (metrics), Loki (logs), Tempo (traces), and Pyroscope (profiling) into one platform. The free tier includes 10,000 active metric series, 50GB of logs, 50GB of traces, and 3 user seats, which is enough for small projects without spending anything.
What it costs in practice. Pro tier charges $19/user/month plus usage fees (metrics at $6.50/thousand series, logs at $0.40/GB ingested). A 5-person team monitoring 30 hosts lands somewhere between $300-500/month. The catch: Grafana has 7+ billing dimensions, and real invoices regularly come in 2-5x higher than estimates.
Where it shines. The entire stack is open source (Mimir, Loki, Tempo). If Grafana Cloud stops working for you, you can self-host the same components with no vendor lock-in. Existing Prometheus dashboards and AlertRules port over directly. The visualization layer is still best-in-class.
Where it falls short. Too many moving parts. Loki’s log query capabilities are less flexible than ClickHouse-based solutions. Enterprise support can be slow; some users report waiting 3 weeks for a pricing quote.
Best fit: Teams already running Prometheus + Grafana who want managed infrastructure without rewriting their monitoring setup. Get started with Grafana Cloud’s free tier.
New Relic: The Enterprise Pick for Teams With Budget
New Relic overhauled its pricing in 2020, switching to a data ingest + user seat model. Every account gets 100GB/month of free ingest plus one Full Platform user. For teams running fewer than 20 hosts, that free tier can cover you indefinitely.
What it costs in practice. Beyond the free tier, you pay $0.40/GB (standard) or $0.60/GB (Data Plus, which gives you 90-day retention). The expensive part is seats: Pro at $349/user/month (annual). The move is to keep Full Platform seats to a minimum (5 or fewer) and give everyone else free Basic seats. That keeps monthly costs between $2,000-3,000 for full-stack coverage.
Where it shines. The most complete feature set of any platform on this list. APM, browser RUM, mobile monitoring, Synthetics, AI-assisted troubleshooting, all in one place. NRQL is an extremely flexible query language. Install the agent and everything works, zero infrastructure to manage.
Where it falls short. Seat pricing hits mid-size teams hard. Standard data retention is just 8 days. Contracts auto-renew and cancellation terminates access immediately. Access from some regions can be inconsistent.
Best fit: 50+ person engineering organizations that want full-stack observability with AI-assisted diagnostics and are willing to pay for a managed experience. Sign up for New Relic’s permanent free tier.
Better Stack: European-Built, Privacy-First
Better Stack is a Czech company that combines uptime monitoring, log management, traces, on-call scheduling, and status pages in a single product. The log engine runs on ClickHouse and supports SQL queries.
What it costs in practice. Responder plan at $29/user/month (annual). EU-region logs cost EUR 0.10/GB for ingest plus EUR 0.05/GB/month for storage. A 5-person team processing 100GB of logs per month pays roughly $160/month. Pricing is straightforward with no hidden dimensions.
Where it shines. European data residency by default, which means GDPR compliance out of the box. The product is simple enough to learn in 5 minutes. There’s a built-in AI SRE agent that investigates root causes automatically. You can import Datadog and Grafana dashboards directly. They offer a 60-day refund guarantee.
Where it falls short. APM depth doesn’t match New Relic (code-level tracing is weaker). The community is small, so you’re dependent on official support. The Singapore region is 3x more expensive ($0.35/GB), which makes it less attractive for Asia-Pacific teams.
Best fit: Small to mid-size teams with European compliance requirements who want an all-in-one lightweight solution and don’t need deep APM. Start Better Stack’s free tier.
Decision Framework
Budget under $500/month: SigNoz self-hosted is your best bet if you have the ops capacity (costs approach zero beyond server hardware). Grafana Cloud’s free tier works if you’re already on Prometheus and don’t want to learn a new stack. SigNoz Cloud’s Teams plan at $199/month fits if you want managed service without the operational overhead.
Enterprise requirements with healthy budget: New Relic gives you the most coverage with the least operational effort. Keep Full Platform seats under 5 (use Pro tier, annual billing), put everyone else on free Basic seats, and your monthly spend stays in the $2,000-3,000 range for complete observability.
European compliance is the priority: Better Stack is the only option that defaults to EU data residency. Logs stored in European nodes at the lowest cost on this list (EUR 0.10/GB ingest). Grafana Cloud also offers EU regions, but the configuration is more involved.
Already running Prometheus: Grafana Cloud is the path of least resistance. Your existing PromQL queries, AlertRules, and Dashboard JSON all transfer directly. No changes needed on the collection side.
Migrating Away from Datadog: Key Steps
1. Export your data. Datadog has no native export feature, but you can pull recent metrics and logs through their API. SigNoz provides automated migration tooling that translates Datadog dashboards into SigNoz format. Better Stack and Grafana both support importing Datadog Dashboard JSON files.
2. Switch your collection agents. Replace the Datadog Agent with OpenTelemetry Collector (SigNoz and Grafana Tempo support it natively) or with the target platform’s own agent (New Relic Agent, Better Stack’s Vector integration). Run both in parallel on a test environment for 1-2 weeks to validate data completeness before cutting over.
3. Rebuild dashboards. Migration tools handle about 80% of your panels automatically. The remaining 20% needs manual query syntax adjustment (Datadog’s query language differs substantially from PromQL, NRQL, and SQL). Budget 1-2 sprint cycles for this work.
4. Migrate alerts. Export your Datadog Monitor configurations. Rewrite alert rules in the new platform’s syntax. Run old and new alerts in parallel for one week. Once you confirm no missed alerts, shut down Datadog.
The Bottom Line
The Datadog alternatives available in 2026 are production-ready, not compromises. SigNoz matches commercial products on performance and features while staying open source. Grafana Cloud’s free tier costs nothing for small teams. New Relic’s free ingest allowance makes lightweight usage permanently free. Better Stack carves out a niche with European compliance and simple UX. None of these are perfect across every dimension, but any of them can replace Datadog for teams that have outgrown its pricing model.
Stay updated with our latest AI insights