Sarah stared at the invoice. Datadog charged $8,200 this month. The culprit: cardinality explosion in their Kubernetes cluster. A developer tagged pod names as metric labels, generating 47,000 high-cardinality time series at $0.05 each. Nobody caught it until the bill arrived.
At 2:30 AM, the production API timed out. She needed distributed tracing to debug the issue, but the Datadog APM trial had expired. The full quote came in at $31 per host per month. With 22 servers, that meant another $682 on top of an already painful bill. She opened a terminal and started grepping logs manually.
This scenario plays out weekly at Series A startups. Datadog is a good product, but for teams of 10 to 50 engineers, its pricing only moves in one direction: up. A full-stack observability setup across 50 hosts easily hits $27,000 per year. That’s roughly 15% of a small engineering team’s salary budget going to monitoring alone. When your runway is 18 months, that number forces hard tradeoffs between observability and hiring.
What Small Teams Actually Need in 2026
Back in 2020, you could get by with Prometheus dashboards in Grafana plus an ELK stack for logs. Maybe a Sentry instance for error tracking. That era is over.
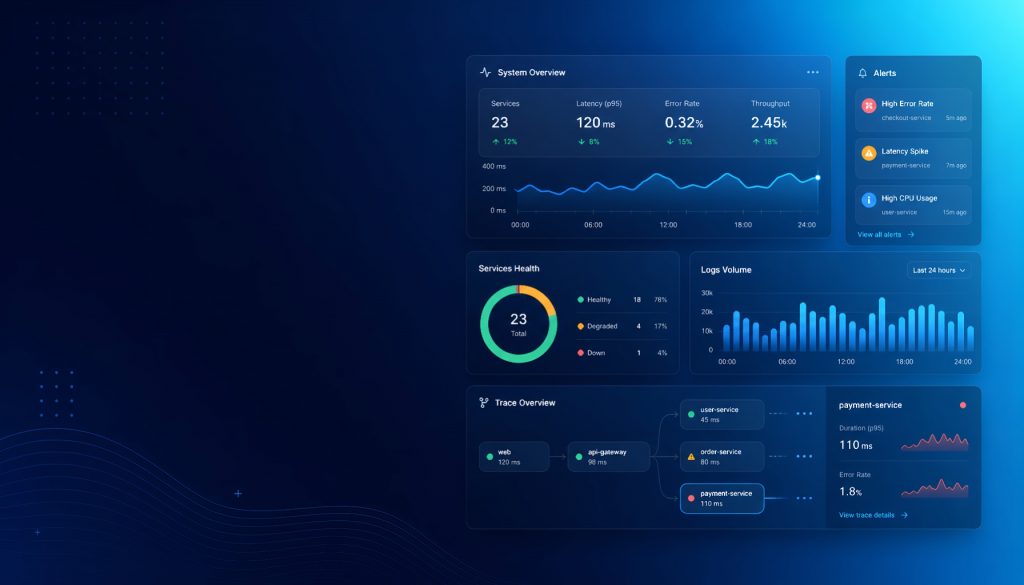
Modern observability requires three-signal correlation: logs, metrics, and traces working together. Not one or two of them. All three. You need to jump from a CPU spike (metric) to the request trace that caused it, then land on the error log that explains why. That correlation workflow is where the real value lives. Without it, you’re context-switching between three different tools, manually matching timestamps, and losing critical minutes during incidents.
OpenTelemetry has become the default standard. OTLP is the HTTP of telemetry data. In 2026, if a tool doesn’t support OpenTelemetry natively, treat it as a red flag. The era of vendor lock-in through proprietary agents is ending. The practical implication: if you instrument your services with OTel SDKs today, you can swap backends tomorrow without touching application code. That flexibility matters more than any single feature comparison.
The third requirement is cost predictability. Small teams can tolerate paying for observability, but they cannot tolerate surprise bills. Per-host pricing, per-seat pricing, and cardinality-based pricing all create scenarios where costs jump 3-5x overnight without any change in actual usage patterns. The tools below each handle pricing differently, and that difference often matters more than feature checklists.
Five Tools Compared in Depth
1. Grafana Cloud: The Free Tier That Actually Works
Grafana Labs spent a decade building the best open-source visualization platform, then wrapped managed backends around it. Grafana Cloud bundles Prometheus (metrics), Loki (logs), and Tempo (traces) with the familiar Grafana UI. All managed, no infrastructure to run.
Free tier allocation: 10,000 active metric series, 50 GB logs, 50 GB traces, 14-day retention. Three users, no credit card required. For small-scale production deployments, this provides real coverage. Many seed-stage startups run entirely within this free tier for their first year.
Strengths: The strongest ecosystem in observability. You’ve probably already used Grafana dashboards, which means your team already knows the query language and visualization patterns. Open-source DNA means no lock-in: if you outgrow Grafana Cloud, you can self-host the same stack. Pricing scales transparently as you grow, with clear per-unit costs for each signal type.
Weaknesses: Configuration complexity is higher than pure SaaS competitors. You’re managing three separate backends (Mimir, Loki, Tempo) even though they share a UI. The learning curve for PromQL, LogQL, and TraceQL simultaneously is steep for junior engineers. Alert rules are scattered across different backends, making unified alert management harder than it should be.
Pricing beyond free tier: Metrics at $8 per 1,000 active series/month, logs at $0.50/GB ingested, traces at $0.50/GB ingested. Predictable, but can add up if your cardinality isn’t controlled.
2. Better Stack: Best Developer Experience
Better Stack combines uptime monitoring, log management, and incident management into a single product. The interface is so clean it feels like Linear built an observability tool. Every interaction is fast, every workflow feels intentional.
Core selling point: Blazing fast log search powered by ClickHouse, built-in status pages, and a complete pipeline from alerting to on-call scheduling to incident management. You don’t need to integrate PagerDuty or Statuspage separately. It’s all there.
Free tier: Limited but exposes full functionality. Paid plans start at $24/month for the logging product. The uptime monitoring product has its own generous free tier with 50 monitors.
Best for: Small teams that prioritize developer experience. Startups that don’t want to cobble together separate on-call systems, status pages, and log management tools. Teams where the person setting up observability is also the person responding to incidents at 3 AM.
Not ideal for: Teams that need complex custom metrics and PromQL queries. Better Stack’s metrics story is thinner than its logging story. If your primary pain point is metric cardinality and dashboard complexity, look elsewhere.
Unique advantage: The incident timeline automatically correlates downtime events with log entries and deployment markers. During postmortems, this saves hours of manual timeline reconstruction.
3. SigNoz: Open-Source Full Stack, Self-Hosted Savings
SigNoz is the only open-source project that bundles logs, metrics, and traces in a single codebase. Built on ClickHouse, it delivers strong query performance across all three signals without requiring you to learn three different query languages.
Self-hosted cost: You pay only for cloud compute. No feature gates, no per-seat licensing, no usage-based billing surprises. A t3.xlarge EC2 instance ($120/month) can handle the observability needs of a 20-service microservices deployment comfortably. For teams with operational capacity, this is the best cost-to-value ratio available.
Cloud version: If you’d rather skip self-hosting, SigNoz Cloud starts at 60-80% cheaper than Datadog for equivalent functionality. Their pricing is transparent: $0.3/GB for logs, $0.1 per million samples for metrics, $0.3/GB for traces.
Strengths: Single pane of glass for all three signals. Native OpenTelemetry support (no proprietary SDKs needed). The correlation between traces and logs works out of the box. ClickHouse gives you sub-second queries even on large datasets. Active development pace with monthly releases.
Weaknesses: Smaller community than Grafana means fewer blog posts, fewer Stack Overflow answers, and fewer pre-built dashboards. The plugin ecosystem is limited compared to Grafana’s hundreds of data source integrations. Enterprise features like SSO and RBAC sit behind the paid tier. Self-hosting means you own the upgrades, backups, and scaling decisions.
4. Axiom: Unlimited Retention with Serverless Architecture
Axiom’s differentiator is unlimited data retention. Unlike competitors that charge by retention period, Axiom separates storage cost from query cost. The architecture is serverless, so there’s no per-host pricing and no infrastructure to size.
Best for: High log volume with low query frequency. Teams that need long-term archival for compliance or audit requirements. If you’re in fintech or healthcare and regulators want 7 years of access logs, Axiom’s model makes this affordable instead of prohibitively expensive.
Free tier: 500 GB ingest per month, 30-day retention. Sufficient for most small teams running fewer than 20 services. The personal plan at $25/month bumps that to unlimited retention.
Strengths: The serverless model means you never think about capacity planning. Ingest whatever you want, query when you need to. The APL query language (based on Kusto/KQL) is approachable for anyone who has used Azure Data Explorer. Data compression is aggressive, so storage costs stay low even at high volumes.
Weaknesses: Tracing capabilities are relatively immature compared to dedicated tracing tools. If distributed tracing is your primary use case, Axiom won’t satisfy you today. Metrics support doesn’t match the depth of Prometheus-based systems. Fewer third-party integrations mean more manual setup for non-standard data sources. Query latency on cold data can be higher than tools that keep everything hot.
5. Uptrace: OpenTelemetry Native, High Value Per Dollar
Uptrace was built around OpenTelemetry from day one. No proprietary agents, no SDK wrappers, no translation layers. For teams already invested in OTel instrumentation, onboarding is frictionless. Point your OTel Collector at Uptrace’s endpoint and you’re done.
Pricing: Usage-based, charged by data volume. Transparent and simple. Typically 5-10x cheaper than Datadog for equivalent workloads. Their pricing page shows exact per-GB costs with no hidden multipliers for high cardinality or custom metrics.
Strengths: If your organization has committed to the OpenTelemetry standard, Uptrace gives you the cleanest integration path. The UI is focused and functional without trying to be everything. Trace analysis and service maps work well. Alerting covers the basics. For a team that wants “good observability at low cost,” Uptrace delivers.
Weaknesses: Lower brand recognition means less community content and fewer integration guides. The community is small, so you’ll rely heavily on official documentation (which isn’t as polished as what you’ll find from larger vendors). Feature velocity is good but the product is less mature than alternatives that have been around longer. Limited dashboard customization compared to Grafana.
How to Choose: A Decision Framework
| Scenario | Recommendation | Reasoning |
|---|---|---|
| Already using Prometheus/Grafana | Grafana Cloud | Seamless migration, ecosystem continuity |
| Prioritize DX, want all-in-one | Better Stack | Best interface, fastest onboarding |
| Have ops capacity, want to minimize cost | SigNoz self-hosted | Best cost-to-value ratio |
| High log volume, need long retention | Axiom | Unlimited retention at no extra charge |
| Fully committed to OpenTelemetry | Uptrace | OTel native, zero friction |
| Not sure where to start | Grafana Cloud free tier | Zero-cost experimentation |
A few additional considerations that don’t fit neatly in the table:
Team size matters for self-hosting. If you have fewer than 3 engineers and no dedicated DevOps/SRE person, avoid self-hosted options. The operational overhead of maintaining ClickHouse, handling upgrades, and debugging ingestion pipeline issues will eat more engineering time than the cost savings justify. Go with a managed service and revisit self-hosting when your team grows.
Data residency requirements may narrow your choices. If you need EU data residency for GDPR compliance, check each vendor’s region availability. Grafana Cloud and Axiom both offer EU regions. SigNoz self-hosted solves this by definition since you control where data lives.
Integration depth with your existing stack matters more than feature comparisons. If your team already uses PagerDuty, Slack, and Terraform, check which observability tool has the deepest integration with those. A tool that sends alerts directly to your existing PagerDuty escalation policy saves you from rebuilding on-call workflows.
Migration Playbook
Start by deploying an OpenTelemetry Collector to unify your data export layer. Regardless of which backend you choose, you only configure data sources once. This single step makes future backend switches trivial. The Collector runs as a sidecar or daemonset in your cluster, receives telemetry from your applications via OTLP, and forwards it to your chosen backend.
Migrate logs first because they’re the easiest signal to validate. You can compare output line-by-line between old and new systems. Set up dual-writing in the OTel Collector: send logs to both your existing system and the new one. After a few days of parallel ingestion, run the same queries against both and compare results. Once logs look good, move traces next, then metrics last.
Metrics tend to have the most dashboard dependencies, so leaving them for last gives your team time to rebuild visualizations incrementally. Don’t try to recreate every existing dashboard on day one. Start with your top 5 critical dashboards (the ones you actually look at during incidents), validate those, and migrate the rest over the following weeks.
Run both systems in parallel for two weeks. Compare alert accuracy, query latency, and coverage gaps. Document any differences your team notices during incident response. Pay special attention to edge cases: high-cardinality queries, long time-range aggregations, and cross-signal correlation workflows.
After the parallel period, cut over to the new system. Update your team’s bookmarks, Slack integrations, and runbook links. The old system can stay read-only for another week as a safety net before you decommission it.
For a 10-person team, this entire process takes one to two weeks of part-time effort. The key factor isn’t tool complexity. It’s whether you’ve standardized your data pipeline with OpenTelemetry beforehand. If you have, switching backends is a one-line config change pointing to a new OTLP endpoint. If you haven’t, the migration is also your opportunity to adopt OTel and set yourself up for painless switches in the future.
The Bottom Line
The observability market has shifted in favor of small teams. Five years ago, your options were “expensive Datadog” or “run everything yourself with duct tape.” Today, generous free tiers, open-source full-stack tools, and OpenTelemetry standardization mean you can get production-grade observability without enterprise budgets.
Pick the tool that matches your team’s operational appetite: managed if you’re engineering-constrained, self-hosted if you’re budget-constrained. Standardize on OpenTelemetry regardless of which backend you choose. And stop paying for cardinality explosions you didn’t ask for.
Related Reading
- 5 Observability Tools That Wont Charge You 8000 Per Month
- Observability on a Startup Budget: 5 Datadog Alternatives That Actually Work in 2026
Stay updated with our latest AI insights