Sarah stared at the invoice. Datadog charged $8,200 this month. The culprit? Cardinality explosion in their Kubernetes cluster. A developer tagged pod names as metric labels, spawning 47,000 high-cardinality time series at $0.05 each.
At 2:30 AM, the production API started timing out. She needed distributed tracing to debug it, but the Datadog APM trial had expired. The quote for full access: $31 per host per month. Across 22 servers, that’s another $682 monthly just to see where requests are failing.
This story plays out weekly at Series A startups. Datadog is a good product. Nobody disputes that. But for teams of 10 to 50 engineers, the pricing only moves in one direction. A full-stack observability setup across 50 hosts easily runs $27,000 per year. That’s 15% of your engineering team’s salary budget going to a monitoring bill.
What Small Teams Actually Need in 2026
Back in 2020, you could get by with Prometheus plus Grafana dashboards and an ELK stack for logs. That era is over.
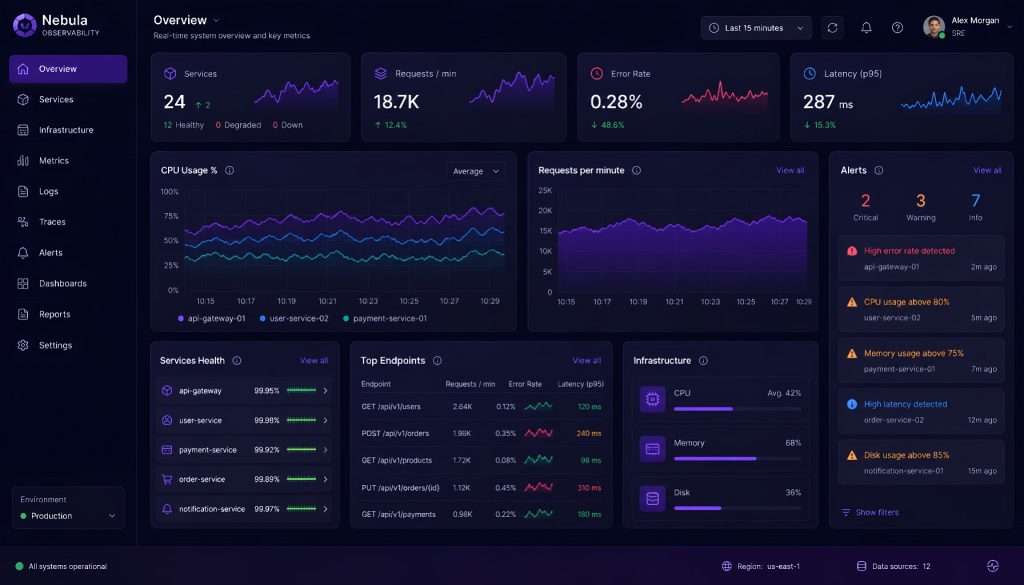
Modern observability means three-signal correlation: logs, metrics, and traces. Not one or two. All three, connected. You need to go from a CPU spike (metric) to the request trace that caused it, then to the error log that explains why. That correlation is where the real value lives. Without it, you’re just looking at pretty charts while guessing at root causes.
OpenTelemetry has become the default standard. OTLP is to telemetry what HTTP is to the web. If a tool doesn’t support OpenTelemetry in 2026, that’s a red flag. The era of vendor lock-in through proprietary agents is done.
Five Tools Compared in Depth
1. Grafana Cloud: The Free Tier That Actually Works
Grafana Labs spent a decade building the best open-source visualization platform, then wrapped managed backends around it. Grafana Cloud gives you Prometheus for metrics, Loki for logs, Tempo for traces, and the familiar Grafana UI. All managed.
Free tier specs: 10,000 active metric series, 50 GB logs, 50 GB traces, 14-day retention. Three users, no credit card required. For small production deployments, this covers real workloads.
Where it shines: Strongest ecosystem (you’ve probably already used Grafana dashboards), open-source DNA means no lock-in, transparent pay-as-you-grow pricing.
Where it hurts: Configuration complexity is higher than pure SaaS competitors. Multiple components mean a steeper learning curve. Alert rules get scattered across different backends. If you want simple, this isn’t it.
2. Better Stack: Best Developer Experience
Better Stack combines uptime monitoring, log management, and incident management into a single product. The interface is so clean it feels like Linear built an observability tool.
Core selling point: Log search is blazing fast (ClickHouse under the hood), built-in status pages, and a complete pipeline from alerting to on-call to incident resolution.
Pricing: Free tier is limited but lets you experience the full feature set. Paid plans start at $24/month.
Good fit for: Small teams that care about developer experience. Startups that don’t want to wire up their own on-call system. Teams where the person setting up monitoring is also the person responding to pages.
Bad fit for: Teams that need complex custom metrics with PromQL queries. If you’re writing recording rules and need sub-minute granularity, look elsewhere.
3. SigNoz: Open-Source Full Stack, Self-Hosted Savings
SigNoz is the only project that puts logs, metrics, and traces into a single open-source codebase. Built on ClickHouse, so query performance is strong even at scale.
Self-hosted cost: You pay for the cloud instance and nothing else. Features aren’t gated. For teams with ops capability, this is the best value per dollar in the entire category.
Cloud version: If you don’t want to run it yourself, SigNoz Cloud pricing comes in 60-80% cheaper than Datadog for equivalent workloads.
The tradeoffs: Community is smaller than Grafana’s. Plugin ecosystem is thin. Enterprise features like SSO and RBAC are locked behind the paid tier. You’re betting on a younger project, which means occasional rough edges in documentation and fewer Stack Overflow answers when you hit problems.
4. Axiom: Unlimited Retention with Serverless Architecture
Axiom’s killer feature is unlimited data retention. Most competitors charge by retention window (keep data 15 days? 30 days? 90 days? Each jump costs more). Axiom doesn’t play that game. The architecture is serverless, and pricing doesn’t scale per host.
Good fit for: High log volume but low query frequency scenarios. Teams that need long-term archival for compliance or audit trails. If you’re in fintech or healthcare and regulators want 12 months of logs, Axiom saves you a fortune compared to alternatives.
Free tier: 500 GB ingestion per month, 30-day retention. For most small teams, that’s enough.
The tradeoffs: Tracing support is weaker than dedicated tracing tools. Metrics capabilities lag behind the Prometheus ecosystem. Fewer third-party integrations. If you need strong APM alongside your logs, you’ll still need another tool.
5. Uptrace: OpenTelemetry Native, Price-Performance Champion
Uptrace was built around OpenTelemetry from day one. No proprietary agents, no custom SDKs to maintain. For teams that have already invested in OTel instrumentation, onboarding is zero-friction. Point your collector at a new endpoint, done.
Pricing model: Per data volume, transparent and simple. In my experience working with teams that migrated from Datadog, the bill dropped by 5x to 10x for equivalent telemetry volume.
The tradeoffs: Low brand recognition means fewer engineers have heard of it. Smaller community, so you’re more reliant on their docs (which aren’t as polished as the bigger players). Tutorials and guides are sparse compared to Grafana or Datadog’s content libraries.
How to Choose: A Decision Framework
| Scenario | Recommendation | Reasoning |
|---|---|---|
| Already using Prometheus/Grafana | Grafana Cloud | Smooth migration path, ecosystem continuity |
| Prioritize developer experience, want all-in-one | Better Stack | Best interface, fastest time to value |
| Have ops capability, want to minimize cost | SigNoz self-hosted | Unmatched cost efficiency |
| High log volume, need long retention | Axiom | Unlimited retention without surcharges |
| Fully committed to OpenTelemetry | Uptrace | OTel-native, zero integration friction |
| Unsure where to start | Grafana Cloud free tier | Zero-cost experimentation |
Migration Playbook
Here’s how I’d approach this if I were running the migration for a 10-person team.
Step one: Deploy an OpenTelemetry Collector and unify your data egress. This is the single most important step. Regardless of which backend you choose, your data sources only get configured once. The Collector becomes your abstraction layer. If you ever need to switch backends again, you change one endpoint instead of re-instrumenting everything.
Step two: Migrate logs first. Logs are the easiest signal to validate. You can run old and new systems side by side, search for the same error, and confirm results match. Once you trust the new system catches what the old one caught, move on.
Step three: Migrate traces, then metrics. Traces are harder to validate because you need to trigger known request paths and verify spans show up correctly. Metrics come last because they often have the most alert rules attached, and you don’t want false alarms during transition.
Step four: Run both systems in parallel for two weeks. Compare alert accuracy, query speed, and team comfort. This overlap costs money, yes. It’s worth it. I’ve seen teams cut over too fast, miss a critical alert that the old system would have caught, and spend a weekend in incident response. Two weeks of overlap insurance is cheap by comparison.
Step five: Kill the old system. Notify your team about the new dashboard URLs. Update runbooks. Close the old account.
The full process takes one to two weeks for a 10-person team. The complexity isn’t in the tools. It’s in whether you standardized your data pipeline with OpenTelemetry beforehand. If you did, switching backends is literally changing a URL in your Collector config. If you didn’t, you’re re-instrumenting services, and that’s where the real time goes.
The Bottom Line
I think the observability market in 2026 has finally reached the point where small teams don’t need to choose between “expensive and good” or “cheap and painful.” The tools listed above are capable for production workloads. They support OpenTelemetry. They correlate across signals. They won’t surprise you with a five-figure bill because someone forgot to exclude debug logs from ingestion.
If you’re paying more than $500/month per engineer for observability, you’re overpaying. If you’re stitching together four different free tiers with duct tape and bash scripts, you’re underpaying in dollars but overpaying in engineering time.
The sweet spot exists. Pick the tool that matches your team’s ops maturity and your actual query patterns, not the one with the best marketing site. Deploy the OTel Collector first, choose a backend second. That order matters.
Related Reading
- 5 Observability Tools That Wont Charge You 8000 Per Month
- Observability on a Startup Budget: 5 Datadog Alternatives That Actually Work in 2026
Stay updated with our latest AI insights