You have a spreadsheet with thousands of sales records. You need to figure out which product line is losing money. You open Python, start writing pandas code, try to plot something. Just getting the environment set up takes half an hour. Or maybe you don’t code at all, so you send the file to a colleague and wait for them to find time.
This is where most people stand with data analysis in 2026. The barrier is too high, or the wait is too long.
AI data analysis tools should fix this problem. But the tools on the market vary wildly. Some are just ChatGPT with a wrapper. Others actually run code, generate charts, and deliver insights. This article tests four mainstream options and tells you which one fits your needs.
Julius AI
What It Does
Julius follows a simple logic: you upload data, ask questions in plain language, and it runs analysis and generates charts. No coding required. No SQL needed.
Upload a sales dataset, ask “which region has the highest return rate,” and Julius delivers a bar chart plus written conclusions. It also proactively suggests “you might want to see quarterly trends.”
Supported formats include CSV, Excel, direct Google Sheets connection, and database connections (PostgreSQL, MySQL).
Chart types cover common needs: line charts, bar charts, scatter plots, heatmaps, funnel charts. Export supports PNG, PDF, and embed codes.
Real-World Experience
For non-technical users, Julius offers the smoothest experience available today. You can ask questions in everyday language without needing to specify methods. It figures out the approach on its own.
But there’s a clear limitation: complex multi-step analysis often breaks down. For example, “group by region, calculate year-over-year growth for each group, then find the top three fastest-growing regions.” This kind of chained operation sometimes goes off track midway, requiring manual correction.
Also, the AI’s explanations can be overly optimistic. It sometimes mistakes correlation for causation. You need to judge the conclusions yourself and not trust blindly.
Pricing
Free tier: 15 queries per month, basic charts
Pro: $25/month, unlimited queries, database connections, team sharing
Team: Starting at $49/month, multi-user collaboration, priority support
Who It’s For
Operations, marketing, product managers. People who need quick answers from data but don’t want to write code.
—
ChatGPT Advanced Data Analysis
What It Does
This is a built-in feature in ChatGPT Plus/Team subscriptions. Essentially, it lets GPT-4o run Python code in a sandboxed environment.
You upload a file, it writes code, executes it, and gives you results. The entire process is transparent. You can see the code it wrote and request modifications.
Supported formats: CSV, Excel, JSON, PDF (table extraction), images (OCR for data recognition).
Real-World Experience
For users with some technical background, ChatGPT Data Analysis has a much higher ceiling than Julius. Since the underlying tool is Python, it can theoretically handle anything pandas/matplotlib/seaborn can handle.
In testing, processing a 50,000-row user behavior dataset for retention analysis, funnel analysis, and user segmentation, ChatGPT completed everything. The code was directly reusable.
The downside is instability. The same question sometimes produces beautiful visualizations, sometimes just text descriptions. Complex tasks require multiple rounds of guided conversation. For people unfamiliar with data analysis workflows, not knowing what to ask becomes a real barrier.
Another issue: file size limit of 512MB. Can’t handle very large datasets. And when each conversation ends, data clears. No persistent storage.
Pricing
ChatGPT Plus: $20/month, includes Advanced Data Analysis
ChatGPT Team: $25/user/month
Enterprise: Custom pricing
Who It’s For
Users with some technical background who need flexible analysis and are willing to spend time tuning prompts. Also good for people learning data analysis. Watching it write code makes excellent study material.
—
Noteable
What It Does
Noteable targets data teams. Its positioning is closer to “AI-enhanced Jupyter Notebook.”
Core functionality: inside a Notebook environment, AI can help you write code, explain code, debug errors, and generate documentation. Supports Python, SQL, and R. Data connections support major warehouses: Snowflake, BigQuery, Redshift, PostgreSQL.
Team collaboration is its strength. Multiple people can edit the same Notebook in real time, with version control, comments, and permission management.
Real-World Experience
If your team already uses Jupyter, Noteable has low migration costs. The AI-assisted coding experience is solid, especially SQL generation. Describe the data you want, and it produces query statements with good accuracy.
But for non-technical users, Noteable’s barrier is too high. The interface is a Notebook, not a chat box. You need to understand the concept of cells and know how to run code.
In 2026, Noteable added a “natural language report” feature that converts Notebooks into shareable report pages. The direction is right, but it’s still rough around the edges.
Pricing
Free tier: Personal use, storage limits
Pro: $19/month, more compute resources, private Notebooks
Team: Starting at $49/month, team collaboration, data connections
Who It’s For
Data analysts, data scientists, technical teams needing collaboration. Not suitable for non-technical users.
—
Rows
What It Does
Rows has a unique position. It’s a spreadsheet, but with built-in AI and data connection capabilities.
You can write AI formulas directly in the spreadsheet. For example, =AI.CLASSIFY(A2, "positive/negative/neutral") for sentiment analysis on a column of text, or =AI.EXTRACT(B2, "company name") to extract information from unstructured text.
Data connections support 30+ sources including Google Analytics, Stripe, HubSpot, and Salesforce. You can pull business data directly into the spreadsheet.
Real-World Experience
Rows solves a very specific problem: you have business data, want some AI processing, but don’t want to leave the spreadsheet workflow.
Testing it on customer feedback data for batch classification, keyword extraction, and summary generation, Rows handled these tasks smoothly. Results appear directly in the spreadsheet, convenient for further processing.
But it’s not a general-purpose data analysis tool. Complex statistical analysis, machine learning, large dataset processing are not Rows’ scenarios.
Also, AI formula calls have costs. The free tier has limited quotas. Large-scale processing burns through credits quickly.
Pricing
Free tier: Basic features, limited AI quotas
Pro: $59/month, more AI quotas, data connections
Business: $149/month, team features, priority support
Who It’s For
Operations, growth, marketing teams. People comfortable working in spreadsheets who need to add an AI processing layer to data.
—
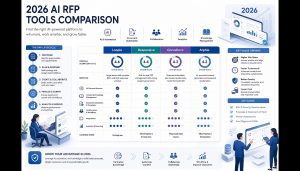
Side-by-Side Comparison
| Dimension | Julius AI | ChatGPT Data Analysis | Noteable | Rows |
|---|---|---|---|---|
| Technical Barrier | Low | Medium | High | Low |
| Analysis Depth | Medium | High | High | Low |
| Team Collaboration | Basic | None | Strong | Medium |
| Data Connections | Medium | Weak | Strong | Strong |
| Price | $25/month | $20/month (includes other features) | $19/month | $59/month |
| Suitable Data Size | Small-Medium | Medium | Large | Small-Medium |
—
The Most Common Traps with These Tools
1. Mistaking “Can Draw Charts” for “Can Analyze”
Many people use these tools for the first time, see charts appear in seconds, and assume the analysis is done. But charts are just the beginning, not the conclusion. The hard parts are: did you ask the right question, are your metrics consistent, have you handled outliers, is the grouping method reasonable.
This is why many teams, after trying everything, say “AI data analysis isn’t that amazing.” It’s not that the tools fail. They mistook visualization speed for analytical capability.
2. Feeding Dirty Data to AI, Then Blaming AI for Inaccuracy
Messy column names, inconsistent time formats, values full of nulls, the same field mixing Chinese and English. This kind of data gives anyone a headache. AI tools can clean part of it, but they’re not magic repair shops.
If your data source is chaotic to begin with, spending time standardizing fields is more valuable than switching tools.
3. Ignoring Permissions and Privacy Issues
Many people testing tools just upload customer lists, order details, financial data without a second thought. That action itself carries risk. Especially with user privacy, medical, financial, or legal data. Check the platform’s storage and training policies first, then decide whether you can upload.
For enterprise teams, whether the platform supports private deployment, audit logs, and permission isolation often matters more than “how smart the model is.”
—
If You Need to Start Today, This Decision Framework Is Enough
Don’t register for four tools at once. Follow this sequence to save time.
Step 1: Check if you can code.
Can’t code? Start with Julius. Know a little? Try ChatGPT. Already a data team? Go straight to Noteable.
Step 2: See where your data lives.
If data mainly sits in Excel and Google Sheets, Julius and Rows will be more comfortable. If data is in databases or warehouses, Noteable provides more value.
Step 3: See who needs the results.
If you’re analyzing for yourself, ChatGPT is enough. If you frequently show results to bosses, sales, or ops teams, Julius’ charts and explanations save trouble. If results eventually need to flow back into spreadsheet workflows, Rows is actually the smoothest.
Step 4: See if you have ongoing analysis needs.
Occasional one-off analysis doesn’t justify adding a tool. Weekly report runs, metric reviews, channel breakdowns justify considering long-term subscriptions.
—
Recommendations by User Type
You’re in operations/marketing/product, don’t code, need quick answers from data
Choose Julius AI. Fastest to learn, most intuitive results. $25/month is worth it.
You have some technical background, need flexible analysis, already subscribe to ChatGPT Plus
Use ChatGPT Advanced Data Analysis directly. No extra cost. High enough ceiling.
You’re a data analyst, team uses Jupyter, need AI-assisted coding
Choose Noteable. Collaboration features and data warehouse connections are its core advantages.
Your workflow lives in spreadsheets, need to add AI processing to data
Choose Rows. But calculate AI quota costs. Large-scale processing might be more expensive than you expect.
A practical tip: if you already subscribe to ChatGPT Plus, master Advanced Data Analysis first. Its ceiling is high enough for most scenarios. Save the money for where it counts. Julius AI works as a supplement when you need better visualizations or simpler interfaces.
Don’t switch tools just to “use AI.” If your current Excel plus colleague collaboration already works, don’t bother. The real value of AI data analysis tools is letting you complete analysis independently when you don’t have data team support.
—
Further Reading
Stay updated with our latest AI insights