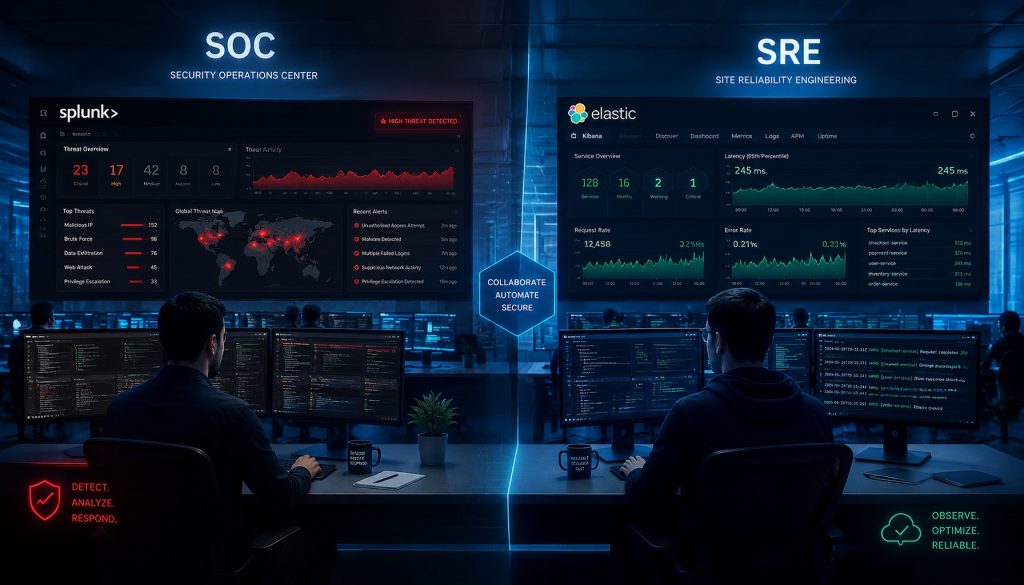
It’s 5:03 PM on a Friday. Production alerts are firing. Your SRE opens Grafana, watches P99 latency spike from 200ms to 3 seconds, and thinks: upstream timeout, need to check traces.
At the next desk, your security engineer opens Splunk instead. Different tool, different question. They’re wondering if this traffic spike is an attack. Last week’s credential leak is still fresh in memory.
Same incident. Two people. Two entirely different mental models.
One person asks “which service is down?” The other asks “who’s attacking us?” This scene plays out thousands of times a day in companies worldwide. And it reveals the fundamental truth about Splunk and Elastic: they aren’t the same species. They just happen to eat the same food source, which we call logs.
The Origin Story Matters
Splunk launched in 2003 when Rob Das wanted to make machine data searchable. But Splunk found product-market fit in security operations. When the SIEM market exploded in the late 2000s, Splunk became the default choice for enterprise security teams. The SPL query language, detection rule libraries, compliance report templates, all of them evolved around one core use case: security operations.
In 2024, Cisco closed its $28 billion acquisition of Splunk. That price tag tells you everything. Cisco didn’t buy a log search engine. They bought a security platform.
Elastic’s story starts differently. Shay Banon built Elasticsearch in 2010 to power a recipe search feature for his wife’s cooking website. This distributed search engine, built on Lucene, carried the DNA of an engineer’s tool: open source, scalable, performance-obsessed. When it merged with Logstash and Kibana to form the ELK Stack, it became the logging solution developers knew by heart.
Elastic identifies as a search company. It builds security products, observability products, enterprise search products. But the underlying logic stays consistent: make search fast, make data findable, give engineers powerful query tools.
This difference in origin shapes every product decision. Splunk asks “what do security analysts need?” Elastic asks “what do engineers need?” Both questions are valid. The answers diverge sharply.
Pricing Models: Where the Real Battle Lives
If you remember only one difference between Splunk and Elastic, remember this: pricing models determine everything.
Splunk charges by data ingestion volume. Sounds reasonable until you operate it in production. Your teams spend hours debating which logs to ingest and which to drop. Turn on debug logging in a microservices architecture and your daily volume can 10x overnight. Launch a new service, watch costs jump another tier. Large enterprises routinely spend millions annually on Splunk licensing.
Elastic’s self-managed option is free and open source. You pay for infrastructure. Elastic Cloud (managed service) charges by node resources, not by log volume ingested. For teams with spiky log patterns or long retention requirements, the cost curve stays manageable.
Free doesn’t mean cheap. Running a 30-node Elasticsearch cluster yourself requires operational expertise many teams underestimate. Misconfigured sharding strategies, mapping explosions, GC pauses causing node failures: these topics dominate Elastic operations forums daily.
The pricing model shapes team behavior. Splunk teams obsess over log filtering and sampling. Elastic teams obsess over cluster stability and storage tiering. Neither is inherently better. The question is which operational burden your team prefers.
Query Languages Encode Different Mental Models
SPL versus KQL looks like syntax on the surface. Underneath, it’s a difference in how you think about data.
SPL uses pipeline syntax: index=main sourcetype=access_combined | stats count by status | where count > 100. Data flows through sequential transformations. Each pipe narrows the dataset, applies aggregations, correlates fields. For security analysts building complex detection rules, this incremental refinement matches their investigative workflow.
KQL feels more like search engine queries: status: 500 AND service: payment. Simple, direct, low learning curve for developers. But when you need complex aggregations, you switch to ES|QL or write JSON DSL directly. The learning curve steepens fast.
Neither approach is objectively superior. A security analyst trained on SPL’s layered analysis model will find KQL limiting. A developer who wants to grep error logs will find SPL’s pipeline syntax over-engineered. The tool you prefer depends on the questions you ask.
The Compliance Moat Runs Deep
In finance, healthcare, and government sectors, Splunk’s position is defensible not because of superior technology but because of accumulated compliance tooling. Audit trail capabilities, regulatory framework mappings, compliance report templates: these are 15 years of accretion. A SOC team’s daily workflow, from alert triage to incident response to forensic analysis, Splunk Enterprise Security covers end-to-end.
For a CISO, choosing Splunk is the safe decision. Not the only decision, but the one that won’t get you fired.
Engineering-led teams, especially those running cloud-native architectures and microservices, find Elastic more natural. APM agents cover mainstream languages, Kubernetes integration is smooth, Filebeat and Metricbeat deploy with near-zero configuration. If your core question is “why did the application break?” rather than “is someone attacking us?”, Elastic’s observability suite delivers.
Budget-sensitive startups and mid-market companies face a different calculation. Splunk’s entry price is a gate, not a speed bump. Alternatives multiply: self-managed Elastic starts small, Better Stack offers clean UX for smaller teams, Grafana Loki paired with the Grafana ecosystem takes the radical position that log queries don’t need full-text indexing (storage costs drop dramatically), Datadog Log Management fits teams already using Datadog APM.
The Feature Comparison That Matters
| Dimension | Splunk | Elastic | |
|---|---|---|---|
| Pricing Model | Data ingestion volume (GB/day) or workload-based | Self-managed free / Cloud by node resources | |
| Query Language | SPL (pipeline-based, steep learning curve) | KQL + ES | QL + Lucene |
| Deployment Options | SaaS-first, on-prem available | Self-managed / Elastic Cloud / ECK on K8s | |
| AI Capabilities | Splunk AI Assistant + auto-detection | Elastic AI Assistant + ESRE vector search | |
| Security Detection | Enterprise Security suite (mature) | Elastic Security (catching up, improving fast) | |
| Observability | Available but not primary focus | APM + Logs + Metrics unified | |
| Long-term Retention Cost | High (scales with time) | Tiered storage (frozen/archive layers are cheap) | |
| Ecosystem | Commercial-focused, Splunkbase app marketplace | Large open-source community, active contributors |
SIEM and Observability Boundaries Are Dissolving
The most significant trend in 2026 isn’t feature additions. It’s category erosion.
Elastic got serious about security in 2020. By 2026, Elastic Security has full SIEM capabilities, endpoint detection (EDR), and cloud security posture management (CSPM). Their position in Gartner and Forrester security reports keeps climbing. For budget-constrained teams needing security capabilities, Elastic’s “one platform for observability and security” pitch resonates.
Splunk is filling observability gaps. Post-Cisco acquisition, integration with AppDynamics and ThousandEyes is accelerating. Cisco’s story is “full-stack observability from network to application to security.” The execution speed is what you’d expect from large-company integrations.
Both sides are betting on AI. Splunk AI Assistant generates SPL queries from natural language, lowering the bar for junior analysts. Elastic integrates vector search and RAG capabilities deep into the product, letting security detection rules auto-correlate context. The honest assessment in mid-2026: both AI features are useful but not transformative yet.
The deeper pattern here is enterprise demand for unified data platforms. Nobody wants to maintain two systems analyzing the same logs. The problem is that security analysis and performance troubleshooting require fundamentally different thinking, like the SRE and security engineer in our opening scene. They need different query patterns, different alert logic, different workflow orchestration. Cramming both into one interface might reduce complexity or might increase it. Neither vendor has delivered a convincing answer yet.
When Each Choice Makes Sense
Splunk fits when compliance requirements dominate, security operations are central, and budget allows for predictable enterprise pricing. The platform has earned its reputation in high-stakes environments where audit trails matter and regulatory frameworks are non-negotiable.
Elastic fits when engineering velocity matters more than off-the-shelf compliance templates, when your architecture is cloud-native and microservices-heavy, when you want flexibility to customize everything, and when you have (or can build) operational expertise to run distributed systems.
The middle ground is messier. Hybrid architectures exist: teams run Elastic for application logs and metrics while maintaining Splunk for security operations. This creates operational overhead but lets each team use their preferred tool.
Smaller organizations often choose based on which pain point hurts more right now. If you’re being attacked, security wins. If your application is unreliable, observability wins. The platform you choose shapes which problems you get good at solving.
The Decision You Actually Make
Our Friday afternoon incident resolved. The SRE found the database connection pool exhaustion in traces, restarted the affected pods, service recovered. The security engineer spent 30 minutes confirming this wasn’t an attack, then closed the ticket.
Different tools. Both solved their problems.
Maybe that’s the honest answer to this comparison. There’s no objectively correct platform. There’s your team, your primary fears, and where you’re willing to spend money and time.
Splunk offers certainty. Elastic offers flexibility. The boundary between them is still moving in 2026. Where you stand might matter more than which tool you pick.
The real question isn’t “which is better?” The real question is “which mental model matches how your team thinks?” An SRE investigating latency spikes thinks in traces, metrics, and logs correlation. A security analyst investigating potential breaches thinks in timelines, indicators of compromise, and lateral movement patterns.
You’re not choosing a log management platform. You’re choosing which problems you want to be structurally good at solving. Choose accordingly.
Related Reading
- Splunk vs Elastic: Which Log Management Platform Should You Choose in 2026?
- 5 Axiom Alternatives for Log Management: Better Stack, Loki, Elastic, Mezmo, and OpenObserve Compared
Stay updated with our latest AI insights