Datadog’s pricing model has a compounding problem. You start with Infrastructure Pro for host monitoring, add APM for traces, layer on Log Management, and before the quarter closes, finance is asking why the observability line item grew 40% without a single new service deployed. A 50-host environment running Infrastructure Pro plus APM routinely hits $2,300/month before logs or synthetic monitors enter the picture. The per-host billing compounds with auto-scaling: one traffic spike that spins up extra containers for 20 minutes can inflate the monthly bill by hundreds of dollars.
The market has noticed. Between 2024 and 2026, four alternatives matured enough to handle production workloads that previously required Datadog’s breadth. SigNoz shipped a ClickHouse-backed platform with native OpenTelemetry support. Grafana Cloud packaged its open-source stack (Mimir, Loki, Tempo) into a managed offering with a generous free tier. New Relic rebuilt its pricing around data ingest rather than hosts. Better Stack combined uptime monitoring, log management, and on-call scheduling into a single product with transparent per-GB pricing.
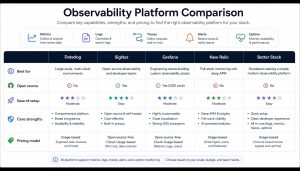
This comparison breaks down where each tool fits, what it costs at realistic scale, and which teams should pick which option. The goal is a decision framework, not a feature checklist.
Capabilities at a Glance
| Dimension | SigNoz | Grafana Cloud | New Relic | Better Stack |
|---|---|---|---|---|
| Pricing model | Self-hosted free; Cloud starts at $199/mo + $0.30/GB logs/traces, $0.10/M metric samples | Free tier (10K metric series, 50GB logs, 50GB traces); Pro $19/user/mo + usage | Free 100GB/mo ingest; overage $0.40/GB; Full Platform seat $349/user/mo (annual) | Free tier 3GB logs + 10 monitors; Responder $29/user/mo; logs $0.10/GB ingest |
| Deployment | Self-hosted (Docker/K8s) or SigNoz Cloud | Fully managed SaaS; open-source stack available for self-hosting | Fully managed SaaS | Fully managed SaaS (US-East, US-West, EU, Singapore) |
| Core signals | APM + Logs + Traces + Metrics + Alerts + Exception Tracking | Metrics (Mimir) + Logs (Loki) + Traces (Tempo) + Profiling (Pyroscope) + k6 load testing | APM + Logs + Metrics + Browser RUM + Mobile + AI troubleshooting + Synthetics | Logs + Uptime + Traces + Metrics + Error Tracking + Status Pages + On-call |
| Learning curve | Medium: self-hosted needs K8s ops knowledge; UI is intuitive | Steep: multi-component assembly (Prometheus + Loki + Tempo), scattered config | Low: turnkey agent install, AI-guided troubleshooting | Low: clean product design, SQL-based log queries, 5-minute setup |
| Integrations | OpenTelemetry native; ClickHouse storage queryable via SQL | 700+ data sources; full Prometheus ecosystem; mature Terraform provider | 400+ integrations; flexible NRQL query language; deep K8s/AWS/Azure support | 100+ integrations; Terraform provider; imports Datadog/Grafana dashboards |
| Data retention | Self-hosted: unlimited (disk-bound); Cloud: 15 days default, extendable | Free tier: 14 days; Pro: pay-per-use up to 13 months | Standard: 8 days; Data Plus ($0.60/GB) extends to 90 days | Free: 3 days; Paid: 30 days+; archive to your own S3 |
| Alerting | Built-in multi-condition alerts with Slack/PagerDuty/Webhook channels | Unified Grafana Alerting rule engine; cross-datasource alert correlation | AI-driven anomaly detection + Errors Inbox + workflow automation | Anomaly detection + unlimited phone/SMS + on-call scheduling + auto-escalation |
SigNoz: The Open-Source Contender
SigNoz is a full-stack observability platform built on ClickHouse, with first-class OpenTelemetry support. The self-hosted Community edition is free with no data caps and no user limits. The commercial Cloud version adds managed infrastructure and a team collaboration layer.
What it costs in practice. A 20-host environment producing 50GB of logs per day costs roughly $200-400/month in server resources when self-hosted (3-4 ClickHouse nodes). On SigNoz Cloud at $0.30/GB, that same 50GB/day runs about $450/month. Compare that to Datadog’s equivalent at $1,200+ for the same workload, and the savings are immediate.
Where it wins. A single platform covers APM, logs, traces, and metrics without requiring you to stitch together separate tools. ClickHouse’s columnar engine handles high-cardinality queries and full-text search without the performance cliffs you hit with Elasticsearch at scale. SigNoz ships a Datadog migration tool that converts dashboards automatically. Because it’s OpenTelemetry-native, your instrumentation stays portable if you ever switch platforms again.
Where it falls short. Self-hosting ClickHouse demands real operational expertise. If your team doesn’t already run stateful distributed systems, the maintenance burden will eat into the cost savings. The Cloud product’s data centers are in the US and India, which means higher latency for teams in other regions. The integration catalog is thinner than what Grafana or New Relic offer.
Best fit: Engineering teams of 10-50 with Kubernetes operational capacity, a preference for data sovereignty, and budgets under $1,000/month for observability.
Grafana Cloud: The Prometheus Upgrade Path
Grafana Cloud bundles Grafana Labs’ open-source projects (Mimir for metrics, Loki for logs, Tempo for traces, Pyroscope for continuous profiling) into a managed platform. The free tier includes 10,000 active metric series, 50GB of logs, 50GB of traces, and 3 user seats, which covers small projects without spending anything.
What it costs in practice. The Pro tier charges $19/user/month as a platform fee, plus usage-based costs: $6.50 per thousand active metric series, $0.40/GB for log writes. A 5-person team monitoring 30 hosts typically lands between $300-500/month. The caveat: Grafana Cloud bills across 7+ dimensions, and real invoices frequently exceed estimates by 2-5x until teams learn to control cardinality.
Where it wins. The entire backend is open source. If Grafana Labs raises prices or changes terms, you can migrate to self-hosted Mimir/Loki/Tempo without rewriting queries or rebuilding dashboards. Existing Prometheus setups, including PromQL queries, alert rules, and dashboard JSON, port directly. Grafana’s visualization layer remains the strongest in the industry for custom dashboards.
Where it falls short. The multi-component architecture creates configuration sprawl. Loki’s log query capabilities are more limited than ClickHouse-based solutions (no full-text indexing by default). Enterprise support has drawn complaints for slow response times, with some users reporting 3-week waits for pricing quotes.
Best fit: Teams already running Prometheus and Grafana who want managed infrastructure without a vendor lock-in cliff. Platform engineering groups that need maximum dashboard flexibility.
New Relic: Full-Stack for Teams That Want Zero Ops
New Relic rebuilt its pricing in 2020 around data ingest volume plus user seats. The free tier gives you 100GB/month of ingest and one Full Platform user with no time limit. For teams under 20 hosts with moderate telemetry volume, this can remain permanently free.
What it costs in practice. Beyond the free tier, ingest costs $0.40/GB (standard) or $0.60/GB (Data Plus, with 90-day retention). The real expense is seats: a Full Platform Pro license runs $349/user/month on an annual contract. The optimization play is limiting Full Platform seats to 5 engineers who need deep debugging access, while everyone else uses free Basic seats for dashboards and alerts.
Where it wins. Feature coverage is the widest of any platform here. APM, browser real-user monitoring, mobile crash reporting, synthetic monitoring, AI-powered root cause analysis, and Kubernetes cluster explorer all come in one package. NRQL (New Relic Query Language) offers analytical flexibility that matches dedicated data warehouses. Agent installation takes minutes with no infrastructure to manage.
Where it falls short. Seat pricing hurts growing teams. Standard data retention is only 8 days, which makes incident retrospectives difficult without paying for Data Plus. Contracts auto-renew, and cancellation means immediate termination rather than running out the billing period.
Best fit: Engineering organizations of 50+ people who want complete observability with zero self-hosted infrastructure and are willing to pay for reduced operational burden.
Better Stack: Simplicity and Compliance in One Package
Better Stack (formerly Logtail + Better Uptime) is a Czech company that combines uptime monitoring, log management, traces, metrics, error tracking, status pages, and on-call scheduling. The log engine runs on ClickHouse with a SQL query interface.
What it costs in practice. The Responder plan at $29/user/month (annual) covers on-call and monitoring. Log ingest in the EU region costs €0.10/GB plus €0.05/GB/month for storage. A 5-person team processing 100GB of logs per month spends roughly $160/month total. Pricing has no hidden dimensions or surprise overages.
Where it wins. EU data residency is the default, making GDPR compliance straightforward without extra configuration. The product is deliberately simple: SQL-based log queries, a clean UI, and 5-minute onboarding. Better Stack ships an AI SRE agent that automates root-cause investigation. Dashboard import from Datadog and Grafana works out of the box. The 60-day money-back guarantee removes adoption risk.
Where it falls short. APM depth doesn’t match New Relic. Code-level tracing and distributed transaction analysis are less mature. The community is small compared to Grafana’s or New Relic’s ecosystems, so you’re relying on official support rather than Stack Overflow. Singapore region pricing is 3x the EU rate ($0.35/GB), making it expensive for Asia-Pacific teams.
Best fit: Small to mid-size teams that prioritize EU compliance, prefer an all-in-one lightweight solution, and don’t need deep code-level APM.
How to Choose: A Decision Framework
Budget under $500/month: Start with SigNoz self-hosted if your team can operate ClickHouse clusters. If you’d rather avoid infrastructure management, SigNoz Cloud’s Teams plan at $199/month or Grafana Cloud’s free tier (when you already use Prometheus) keeps you within budget.
Enterprise-scale, budget available: New Relic delivers the most complete platform with zero operational overhead. Keep Full Platform seats under 5 and use free Basic seats for the rest of the team to control costs in the $2,000-3,000/month range for full-stack monitoring.
EU/Privacy compliance as a requirement: Better Stack is the only option with EU data residency as the default behavior. Grafana Cloud offers EU regions too, but requires more configuration. If compliance is the primary driver, Better Stack’s simplicity and transparent pricing make it the faster path.
Existing Prometheus investment: Grafana Cloud is the natural upgrade. Your PromQL queries, alert rules, and dashboard definitions transfer directly. No collector-side changes required.
Migrating Away from Datadog
The migration path follows four stages regardless of which alternative you pick.
Stage 1: Data export. Datadog has no native bulk export feature. Use the Datadog API to pull recent metrics and log samples for validation. SigNoz offers an automated migration tool that translates Datadog dashboards into its format. Both Better Stack and Grafana support Datadog dashboard JSON imports.
Stage 2: Collector swap. Replace the Datadog Agent with OpenTelemetry Collector (for SigNoz or Grafana Tempo), the New Relic agent, or Vector (for Better Stack). Run both collectors in parallel for 1-2 weeks on a staging environment to confirm data completeness before cutting over production.
Stage 3: Dashboard reconstruction. Automated tools handle roughly 80% of panel conversions. The remaining 20% requires manual query translation because Datadog’s query syntax differs substantially from PromQL, NRQL, and SQL. Budget 1-2 sprint cycles for this work.
Stage 4: Alert migration. Export Datadog Monitor configurations, rewrite alert rules in the target platform’s syntax, run old and new alerts in parallel for one week, and decommission Datadog monitors only after confirming zero missed alerts.
The Bottom Line
The Datadog alternatives available in 2026 are production-grade tools, not stopgaps. SigNoz matches commercial platforms on performance and functionality while giving teams real cost control through self-hosting. Grafana Cloud provides an escape hatch through open-source portability. New Relic’s free tier and per-ingest pricing work for teams that control their data volumes carefully. Better Stack carves out a clear position on compliance and simplicity.
No single tool replaces every Datadog capability, but for most teams, the overlap is large enough that switching saves 40-70% on observability costs without meaningful capability loss. The question isn’t whether alternatives can handle your workload. It’s which tradeoff profile fits your team’s operational capacity, compliance requirements, and budget constraints.
Stay updated with our latest AI insights