, –
title: “Best Datadog Alternatives for Observability in 2026: SigNoz vs Grafana Cloud vs New Relic vs Better Stack”
slug: best-datadog-alternatives-observability-2026
category: comparisons
language: en
focus_keyword: Datadog alternatives
seo_title: “Best Datadog Alternatives in 2026: SigNoz vs Grafana Cloud vs New Relic vs Better Stack Compared”
seo_description: “A detailed comparison of four Datadog alternatives for observability. Pricing breakdowns, feature maps, and migration paths to help you pick the right platform.”
, –
Datadog Bills Are Out of Control. Here’s What Actually Works Instead.
Run 50 hosts on Datadog Infrastructure Pro plus APM and you’re looking at $2,300/month before you even add logs or Synthetics. The per-host pricing stacked with per-product add-ons means a single autoscaling spike can blow through your monthly budget overnight. In 2026, open-source and newer commercial platforms have matured enough that mid-size engineering teams no longer need to accept this pricing model as inevitable.
We tested four serious alternatives against real-world workloads and pricing scenarios. Here’s what we found.
Core Comparison Table
| Dimension | SigNoz | Grafana Cloud | New Relic | Better Stack |
|---|---|---|---|---|
| , , , , , – | , , , , | , , , , , , , – | , , , , , – | , , , , , , , |
| Pricing model | Self-hosted free; Cloud $0.30/GB logs+traces, $0.10/million metric samples, base fee from $199/month | Free tier includes 10K metric series + 50GB logs + 50GB traces; Pro $19/user/month + usage fees | Free 100GB/month ingestion; overage $0.40/GB; Full Platform seat $349/user/month (Pro annual) | Free tier 3GB logs + 10 monitors; Responder $29/person/month (annual); logs €0.10/GB ingestion (EU region) |
| Deployment | Self-hosted (Docker/K8s) or SigNoz Cloud | Fully managed SaaS; underlying open-source stack (Mimir+Loki+Tempo) can be self-hosted | Fully managed SaaS | Fully managed SaaS (EU/US-East/US-West/Singapore nodes) |
| Feature coverage | APM + Logs + Distributed Tracing + Metrics + Alerts + Exception Tracking, OpenTelemetry native | Metrics (Mimir) + Logs (Loki) + Traces (Tempo) + Profiling (Pyroscope) + k6 load testing | APM + Logs + Metrics + Browser RUM + Mobile + AI troubleshooting + Synthetics, 50+ capabilities | Logs + Uptime monitoring + Traces + Metrics + Error tracking + Status pages + On-call management |
| Learning curve | Medium: self-hosted requires K8s ops experience; UI is intuitive, OTel SDK onboarding is standardized | Steep: multi-component assembly (Prometheus + Loki + Tempo), configuration spread across tools | Low: works out of the box, one-click Agent install, AI-guided troubleshooting | Low: clean product design, SQL-based log queries, 5-minute setup |
| Integration ecosystem | OpenTelemetry native, supports all OTel SDK languages; ClickHouse storage allows direct SQL queries | 700+ data sources; full Prometheus community coverage; mature Terraform provider | 400+ integrations; flexible NRQL query language; deep Kubernetes, AWS, Azure connectors | 100+ integrations; Terraform provider; can import Datadog/Grafana dashboards; AI SRE agent |
| Data retention | Self-hosted unlimited (disk-dependent); Cloud default 15 days, extendable | Free tier 14 days; Pro pay-as-you-go up to 13 months | Standard 8 days; Data Plus $0.60/GB extends to 90 days | Free tier 3 days; paid 30 days+; supports archiving to your own S3 |
| Alerting | Built-in multi-condition alerts + notification channels (Slack/PagerDuty/Webhook) | Grafana Alerting unified rules engine; supports cross-datasource alerts | AI-driven anomaly detection + Errors Inbox + workflow automation | Anomaly detection alerts + unlimited phone/SMS notifications + on-call scheduling + auto-escalation |
| Community & support | GitHub 18K+ Stars; active Slack community; core team participates directly | Grafana Labs-led; largest open-source monitoring community globally; massive Stack Overflow coverage | Enterprise SLA support (Pro 2h / Enterprise 1h response); active community forum | Czech company, fast response times; 60-day money-back guarantee; clear docs but smaller community |
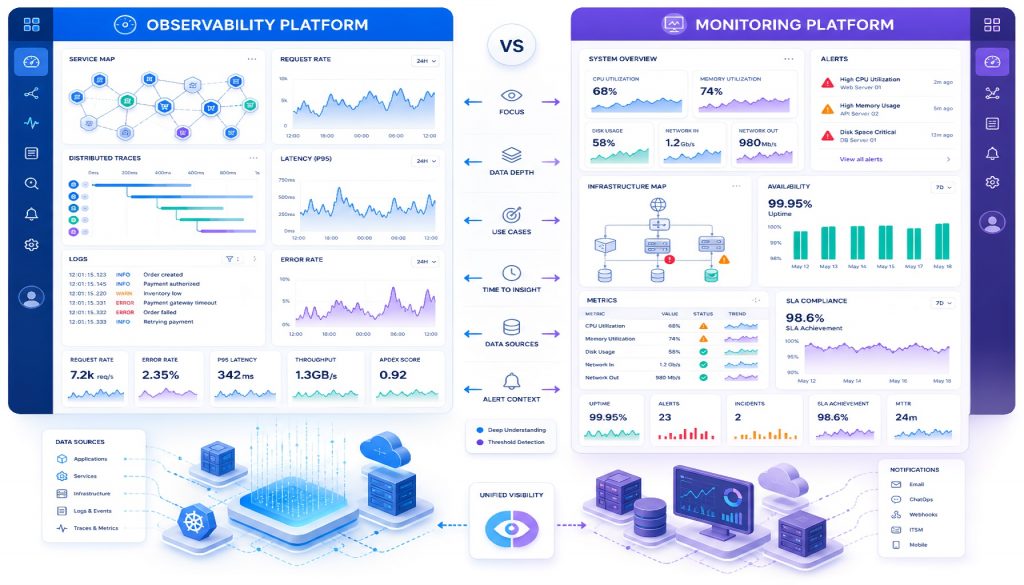
Deep Dive: Each Platform on Its Own Terms
SigNoz: The Best Option for Open-Source Teams
SigNoz is an open-source full-stack observability platform built on ClickHouse for storage with native OpenTelemetry support. The self-hosted Community edition is completely free with no data caps and no user limits.
Pricing in practice: 20 hosts generating 50GB of logs daily requires 3-4 ClickHouse nodes when self-hosted (roughly $200-400/month in server costs). On SigNoz Cloud at $0.30/GB, that same 50GB/day comes to around $450/month, about 60% cheaper than equivalent Datadog coverage.
What works well:
- Single platform covers APM, logs, traces, and metrics without assembling separate components
- ClickHouse query performance is brutal in the best way: full-text search and high-cardinality queries run fast
- Built-in Datadog migration tooling that batch-converts dashboards
- OpenTelemetry-native means no proprietary vendor lock-in on instrumentation
Where it falls short:
- Self-hosted ClickHouse clusters need a dedicated maintainer; teams under 5 engineers may find this burdensome
- Cloud data centers are in the US and India only; latency matters if your team operates from other regions
- Integration catalog is smaller than established players
Best fit: Engineering teams of 10-50 with K8s operations experience who want data sovereignty and aggressive cost control. Try SigNoz Cloud free for 30 days.
Grafana Cloud: The Natural Upgrade Path for Prometheus Users
Grafana Cloud is Grafana Labs’ managed service bundling Mimir (metrics), Loki (logs), Tempo (traces), and Pyroscope (continuous profiling) into one platform. The free tier ships with 10,000 active metric series + 50GB logs + 50GB traces + 3 user seats, which covers many small projects without spending a dollar.
Pricing in practice: Pro tier costs $19/user/month plus usage fees (metrics at $6.50/thousand series, logs at $0.40/GB ingested). A 5-person team monitoring 30 hosts lands around $300-500/month. One warning: Grafana has 7+ billing dimensions, and real invoices frequently come in 2-5x higher than initial estimates.
What works well:
- Entire underlying stack is open-source (Mimir, Loki, Tempo); if you’re unhappy, you can self-host the same components with your data intact
- Existing Prometheus dashboards and AlertRules migrate directly with zero changes to collection agents
- Visualization capabilities remain best-in-class across the industry
Where it falls short:
- Multiple components with scattered configuration creates operational overhead
- Loki’s log query engine is less flexible than ClickHouse-based alternatives for complex searches
- Enterprise support has slow turnaround; some users report waiting 3 weeks for a pricing quote
Best fit: Teams already running Prometheus + Grafana who want managed infrastructure without rethinking their toolchain. Platform engineering teams that need maximum dashboard customization. Get started with Grafana Cloud free tier.
New Relic: The Enterprise Choice When Budget Isn’t the Bottleneck
New Relic rebuilt its pricing model in 2020 around data ingestion volume plus user seats. The free tier includes 100GB/month of ingestion and 1 Full Platform user, which lets teams running under 20 hosts use it indefinitely at zero cost.
Pricing in practice: Beyond the free quota, ingestion costs $0.40/GB (standard) or $0.60/GB (Data Plus with 90-day retention). The expensive part is seats: Pro at $349/user/month (annual billing) means 5 Full Platform users run $1,745/month. The cost-control trick is keeping most of your organization on free Basic seats and limiting Full Platform access to the engineers who actually need advanced querying.
What works well:
- Most complete feature set of any platform: APM, Browser RUM, Mobile, Synthetics, AI troubleshooting, all under one roof
- NRQL query language is extremely flexible for ad-hoc investigation
- Zero operational overhead: install the agent and everything works
- AI-assisted root cause analysis saves real debugging time
Where it falls short:
- Seat pricing stings for mid-size teams that need broad engineering access
- Standard data retention is only 8 days (fine for alerting, painful for trend analysis)
- Contracts auto-renew and cancellation is immediate termination
- Occasional access instability from certain regions
Best fit: Engineering organizations of 50+ who want full-stack observability without running any infrastructure and are willing to pay for that convenience. Sign up for New Relic’s permanent free tier.
Better Stack: European Roots, Privacy-First Design
Better Stack is a Czech company that bundles Uptime monitoring, log management, distributed tracing, on-call scheduling, and status pages into a single product. Their log engine also runs on ClickHouse with SQL query support.
Pricing in practice: Responder plan at $29/person/month (annual), EU-region logs at €0.10/GB ingestion + €0.05/GB/month storage. A 5-person team with 100GB logs/month lands around $160/month. Pricing is transparent with no hidden billing dimensions.
What works well:
- Czech company with European data residency by default; GDPR compliance is built into the foundation, not bolted on
- Product design is minimal and focused: teams get productive within 5 minutes
- Built-in AI SRE agent that automatically investigates root causes
- Supports importing Datadog and Grafana dashboards directly
- 60-day money-back guarantee reduces switching risk
Where it falls short:
- APM depth doesn’t match New Relic (code-level tracing is weaker)
- Smaller community means you’re relying on official support rather than StackOverflow answers
- Singapore node pricing is 3x the EU rate ($0.35/GB), making it expensive for Asia-Pacific teams
Best fit: Teams with European compliance requirements who prefer an all-in-one lightweight solution and don’t need deep APM code-level instrumentation. Start with Better Stack’s free tier.
Decision Framework: Pick Based on Your Constraints
Monthly budget under $500: Start with SigNoz self-hosted if your team has the Kubernetes operations skill to maintain ClickHouse (cost approaches zero beyond server rental). Otherwise, Grafana Cloud’s free tier gives you real monitoring at zero cost when you already have Prometheus fundamentals in place. SigNoz Cloud’s Teams plan at $199/month also fits this budget for teams that want managed infrastructure.
Enterprise requirements with flexible budget: New Relic delivers the least operational friction. Keep Full Platform seats under 5 (Pro tier), assign everyone else free Basic seats, and you can cover full-stack observability for $2,000-3,000/month with no infrastructure to manage.
European or privacy compliance as a hard requirement: Better Stack is the only option that defaults to European data residency. Logs live in EU nodes at the lowest cost in this comparison (€0.10/GB ingestion). Grafana Cloud also offers EU regions but requires more configuration to enforce data boundaries.
Existing Prometheus stack you want to keep: Grafana Cloud is the frictionless upgrade. Your current PromQL queries, AlertRules, and Dashboard JSON files migrate directly without touching collection agent configs.
Migrating Off Datadog: A Practical Playbook
Step 1: Data Export
Datadog has no native bulk export feature. Use their API to pull recent metrics and logs programmatically. SigNoz ships automated migration tooling that translates Datadog dashboards into SigNoz format. Better Stack and Grafana both support importing Datadog Dashboard JSON directly.
Step 2: Switch Collection Agents
Replace the Datadog Agent with OpenTelemetry Collector (natively supported by SigNoz and Grafana Tempo) or your target platform’s agent (New Relic Agent, Better Stack’s Vector integration). Run both in parallel on a staging environment for 1-2 weeks to confirm data completeness before cutting over.
Step 3: Dashboard Reconstruction
Migration tools handle roughly 80% of dashboard panels automatically. The remaining 20% requires manual query syntax adjustments since Datadog’s query language differs significantly from PromQL, NRQL, and SQL. Budget 1-2 sprint cycles for this work.
Step 4: Alert Migration
Export Datadog Monitor configurations. Rewrite alert rules in the new platform’s syntax. Run old and new alerts in parallel for one week. Once you’ve confirmed zero missed alerts, disable Datadog monitors and cancel the contract.
The Bottom Line
Datadog alternatives in 2026 are not compromises. SigNoz’s open-source approach matches commercial products on performance and features. Grafana Cloud’s free tier gives small teams real monitoring at zero cost. New Relic’s free ingestion quota lets lightweight deployments run indefinitely without paying. Better Stack differentiates with European compliance and clean design that doesn’t require a week of onboarding.
No single platform is perfect for every team. But the days when Datadog was the only serious option for production observability are over. Pick the tool that matches your constraints, run a parallel evaluation for two weeks, and stop paying for pricing complexity you never agreed to.
Stay updated with our latest AI insights
相关文章