Datadog has become synonymous with modern observability, but its pricing model can be a brutal wake-up call. Many teams start with Datadog's generous free tier, only to watch their bills skyrocket as their infrastructure scales. If you're exploring Datadog alternatives in 2026, you're not alone—and you have more options than ever.
This guide compares four serious contenders: SigNoz, Grafana Cloud, New Relic, and Better Stack. We'll break down their pricing models, feature sets, deployment options, and real-world use cases to help you find the right observability platform for your needs.
Why Teams Are Looking Beyond Datadog
Datadog is powerful, no question. But three pain points consistently drive teams to evaluate alternatives:
1. Unpredictable Pricing
Datadog charges per host, per custom metric, per ingested log, per APM-traced service, and per synthetic test. This multi-dimensional pricing model makes cost forecasting nearly impossible. Teams regularly report bill shock when traffic spikes or they add new services.
2. Vendor Lock-In
Datadog's proprietary agent and data format make migration difficult. Once you've instrumented your entire stack with Datadog agents and built dashboards around their specific query language, switching platforms becomes a major project.
3. Overkill for Mid-Size Teams
Datadog targets enterprise customers with deep pockets. If you're running 20-50 services and don't need enterprise SSO, custom RBAC policies, or dedicated support, you're paying for features you'll never use.
The Four Alternatives: Quick Overview
Before we dive deep, here's how these platforms position themselves:
- SigNoz: Open-source, OpenTelemetry-native, self-hosted or cloud
- Grafana Cloud: Unified observability with Prometheus, Loki, and Tempo
- New Relic: All-in-one platform with AI-powered insights
- Better Stack: Incident management focused, logs and uptime monitoring
Now let's examine each in detail.
SigNoz: Open Source and OpenTelemetry-Native
SigNoz emerged as a direct response to Datadog's pricing pain. Built on OpenTelemetry from day one, it offers a refreshing approach: own your data, control your costs.
Key Features
- Unified Observability: Traces, metrics, and logs in a single platform
- OpenTelemetry Native: No proprietary agents—use the CNCF standard
- Self-Hosted or Cloud: Deploy on your infrastructure or use SigNoz Cloud
- Query Builder: ClickHouse-powered analytics without learning a new query language
- Exceptions Tracking: Automatic error grouping and stack trace analysis
Pricing Model
SigNoz offers two deployment options:
Self-Hosted (Open Source)
- Free forever
- You manage the infrastructure (typically $200-500/month on AWS/GCP)
- No data egress fees, no per-seat charges
- Community support via Slack
SigNoz Cloud
- $199/month for up to 10M spans and 1GB logs
- Pay-as-you-go beyond base tier
- Managed infrastructure, automatic updates
- Email support included
Best For
SigNoz shines for engineering teams that:
- Want to avoid vendor lock-in with OpenTelemetry
- Need cost predictability for growing infrastructure
- Have Kubernetes expertise for self-hosting
- Prefer open-source tools with active communities
Limitations
- Younger ecosystem compared to Datadog (fewer integrations)
- Self-hosted setup requires DevOps knowledge
- Cloud offering lacks some enterprise features (SAML SSO coming soon)
- Smaller community means fewer third-party resources
Grafana Cloud: The Unified Observability Stack
Grafana Labs has built an impressive portfolio: Grafana for visualization, Prometheus for metrics, Loki for logs, Tempo for traces, and Mimir for long-term storage. Grafana Cloud packages these into a managed service.
Key Features
- Best-in-Class Visualization: Grafana's dashboard flexibility is unmatched
- Prometheus Integration: Native support for Prometheus metrics
- Loki for Logs: Label-based log aggregation, not full-text indexing
- Tempo for Traces: Cost-efficient distributed tracing
- OnCall Incident Management: Built-in on-call scheduling and alerting
Pricing Model
Grafana Cloud uses a consumption-based model:
Free Tier
- 10K Prometheus series
- 50GB logs
- 50GB traces
- 3 active users
- 14-day retention
Pro Tier
- $8/month per active user
- $0.30 per 1K additional series
- $0.50 per GB logs
- $0.50 per GB traces
- Configurable retention
Best For
Grafana Cloud is ideal if you:
- Already use Prometheus and want unified observability
- Need flexible, customizable dashboards
- Want to consolidate visualization tools
- Have developers comfortable with PromQL
Limitations
- Loki's label-based approach requires different mental model than full-text search
- Pricing can escalate with high-cardinality metrics
- Integration between components isn't always seamless
- Alerting configuration can be complex
New Relic: AI-Powered Full-Stack Observability
New Relic has reinvented itself in recent years, moving from traditional APM to a unified observability platform with AI assistance baked in.
Key Features
- Full-Stack Observability: Infrastructure, applications, logs, and synthetics
- AI-Powered Insights: Automatic anomaly detection and root cause analysis
- NRQL Query Language: Powerful querying across all data types
- CodeStream Integration: IDE-integrated observability for developers
- Comprehensive Integrations: 600+ pre-built integrations
Pricing Model
New Relic's pricing is based on data ingestion and users:
Free Tier
- 100GB data ingest per month
- 1 full platform user
- Unlimited basic users
- 8-day retention
Standard Plan
- $0.30 per GB ingested beyond free tier
- $99/month per full platform user
- $49/month per core user
- Configurable retention (additional cost)
Best For
New Relic works well for teams that:
- Need enterprise-grade features and support
- Want AI-assisted troubleshooting
- Require extensive pre-built integrations
- Can justify the cost for full platform users
Limitations
- User-based pricing can get expensive for larger teams
- Data ingest charges add up quickly at scale
- Steeper learning curve for NRQL
- Overkill for smaller projects
Better Stack: Incident-Centric Observability
Better Stack (formerly Logtail) takes a different approach: rather than trying to do everything, it focuses on logs, uptime monitoring, and incident management.
Key Features
- Structured Logs: JSON-native log management with fast search
- Uptime Monitoring: Status pages and synthetic checks
- Incident Management: On-call scheduling, escalation policies, phone/SMS alerts
- Status Pages: Public and private status pages for customers
- Developer-Friendly: SQL-like query language, API-first design
Pricing Model
Better Stack has separate pricing for Logs and Uptime:
Logs
- Free: 1GB/month, 7-day retention
- Startup: $20/month for 10GB, 30-day retention
- Growth: $100/month for 100GB, 90-day retention
Uptime
- Free: 10 monitors, 3-minute checks
- Plus: $22/month for 100 monitors, 30-second checks
- Team: $69/month for unlimited monitors, 30-second checks
Best For
Better Stack is perfect for:
- Startups focused on uptime and incident response
- Teams that need simple, fast log search
- Organizations wanting public status pages
- Companies prioritizing developer experience
Limitations
- No APM or distributed tracing
- Limited metrics collection
- Fewer integrations than full-featured platforms
- Not suitable for complex microservices observability
Head-to-Head Comparison
Pricing at Scale
For a typical mid-size application (50 services, 500GB logs/month, 10M traces):
- SigNoz Cloud: ~$800/month
- SigNoz Self-Hosted: ~$400/month infrastructure + engineering time
- Grafana Cloud: ~$1,200/month
- New Relic: ~$2,500/month (with 5 full users)
- Better Stack: ~$500/month (logs + uptime only, no traces)
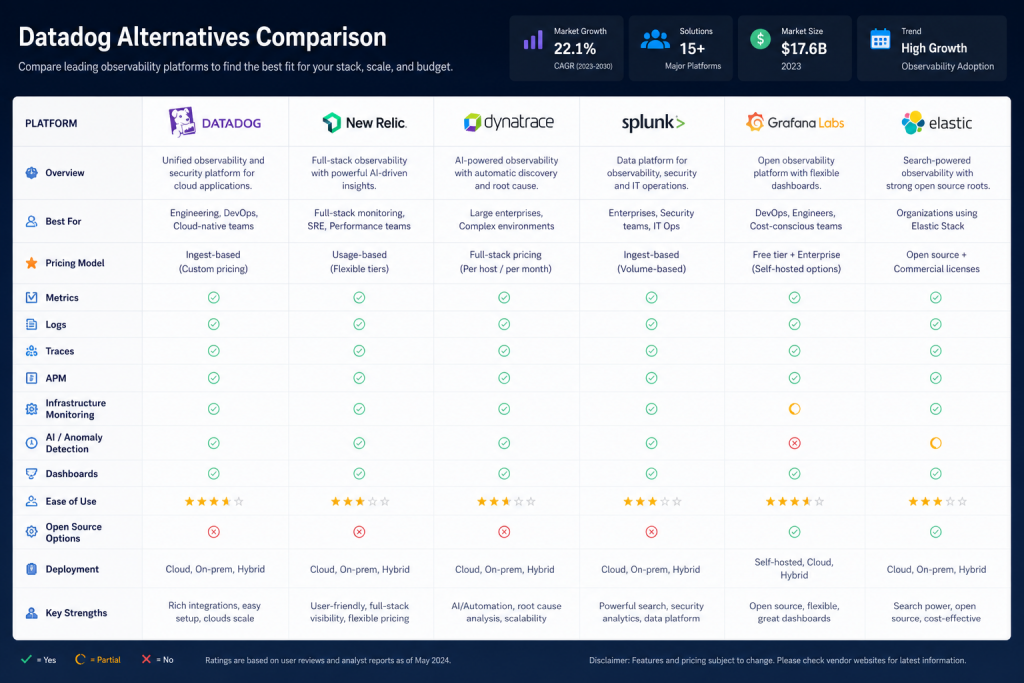
Feature Coverage
| Feature | SigNoz | Grafana Cloud | New Relic | Better Stack |
|---|---|---|---|---|
| APM/Traces | ✅ | ✅ | ✅ | ❌ |
| Metrics | ✅ | ✅ | ✅ | Limited |
| Logs | ✅ | ✅ | ✅ | ✅ |
| Uptime Monitoring | ✅ | ✅ | ✅ | ✅ |
| Incident Management | Basic | ✅ (OnCall) | ✅ | ✅ |
| Status Pages | ❌ | ❌ | ❌ | ✅ |
| AI Insights | ❌ | ❌ | ✅ | ❌ |
| OpenTelemetry Native | ✅ | Partial | Partial | ❌ |
- SigNoz: Self-hosted or cloud, any Kubernetes cluster
- Grafana Cloud: Fully managed SaaS only
- New Relic: Fully managed SaaS only
- Better Stack: Fully managed SaaS only
Learning Curve
- SigNoz: Low (intuitive UI, standard OpenTelemetry)
- Grafana Cloud: Medium (requires PromQL knowledge)
- New Relic: Medium-High (NRQL, complex UI)
- Better Stack: Low (SQL-like queries, simple interface)
Migration Considerations
Switching observability platforms is never trivial. Here's what to expect:
From Datadog to SigNoz
Effort: Medium
- Replace Datadog agents with OpenTelemetry collectors
- Migrate dashboards (no automatic conversion)
- Recreate alerts and notification channels
- Train team on new query syntax
Timeline: 2-4 weeks for full migration
From Datadog to Grafana Cloud
Effort: Medium-High
- Instrument with Prometheus exporters and Grafana Agent
- Rebuild dashboards (Grafana's flexibility helps)
- Set up Loki for logs (requires label design)
- Configure Tempo for traces
Timeline: 3-6 weeks depending on complexity
From Datadog to New Relic
Effort: Low-Medium
- Install New Relic agents (similar to Datadog workflow)
- Migrate dashboards (some automatic import possible)
- Recreate alerts
- Learn NRQL query language
Timeline: 2-3 weeks for basic migration
Making Your Decision
Choose SigNoz if:
- You want OpenTelemetry-native observability
- Cost predictability is critical
- You're comfortable self-hosting or want data sovereignty
- You need traces, metrics, and logs in one platform
Choose Grafana Cloud if:
- You already use Prometheus and Grafana
- Dashboard customization is a priority
- You need best-in-class visualization
- You want to consolidate multiple tools
Choose New Relic if:
- You need enterprise features and support
- AI-powered insights justify the cost
- You want comprehensive out-of-box integrations
- Budget is less of a constraint
Choose Better Stack if:
- Logs and uptime monitoring are your primary needs
- You prioritize incident management and status pages
- You want simplicity over comprehensive features
- You're an early-stage startup watching costs
The OpenTelemetry Factor
One critical consideration for 2026: OpenTelemetry adoption. As the CNCF standard for observability, OpenTelemetry offers vendor neutrality and future-proofing. SigNoz's native OpenTelemetry support means you can switch vendors later without re-instrumenting your entire application.
Grafana Cloud and New Relic support OpenTelemetry but still rely on proprietary agents for full functionality. Better Stack doesn't support OpenTelemetry traces at all.
If avoiding vendor lock-in matters to you, prioritize platforms with first-class OpenTelemetry support.
Final Thoughts
Datadog remains a solid choice for large enterprises with unlimited budgets, but the observability landscape has evolved. In 2026, you have legitimate alternatives that deliver comparable functionality at a fraction of the cost.
For most mid-size teams, SigNoz offers the best balance of features, cost, and flexibility. Grafana Cloud is unbeatable if visualization is your priority. New Relic brings AI-powered insights for teams that can afford it. Better Stack delivers focused excellence in logs and incident management.
The right choice depends on your team size, technical expertise, budget constraints, and observability priorities. Whichever platform you choose, you'll likely wonder why you didn't make the switch sooner.
Stay updated with our latest AI insights