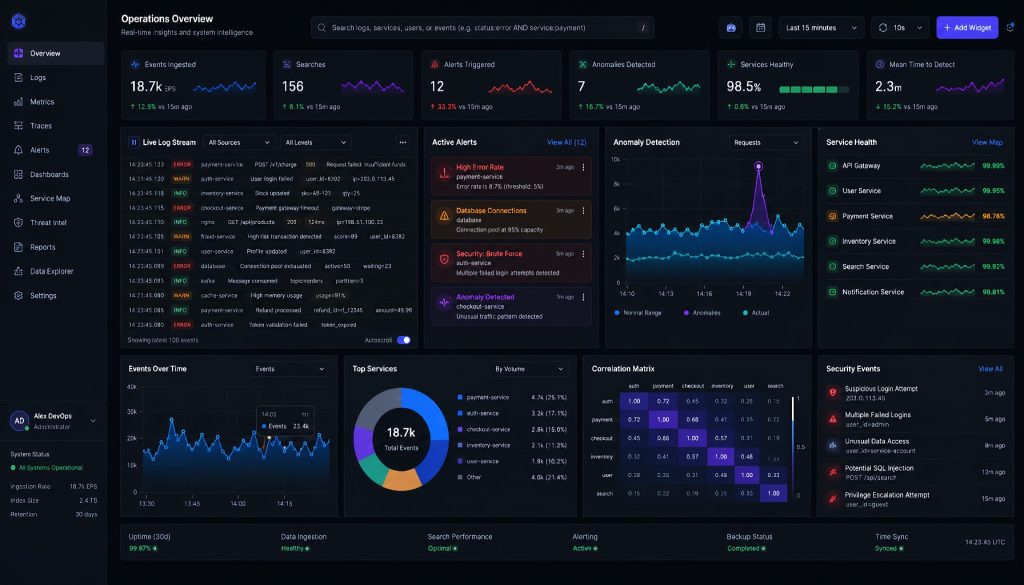
2:47 AM. Your phone buzzes. PagerDuty shoves a P1 in your face: core microservice error rate spiking to 12%. You rub your eyes, crack open the laptop, log into Splunk Cloud, type your query. Eight seconds to get results. Twenty minutes to pinpoint the issue, ten more to fix it. Back in bed by 3:30.
Next morning, you check Splunk’s usage panel. This month’s log ingestion has already blown past your contract cap by 35%. The overage charges are on-demand pricing. Your bill estimate just jumped by twenty grand. And that 2 AM incident? Root cause was a downstream dependency timeout. Maybe a few hundred log lines actually mattered. The rest was debug noise. You paid to store noise, then paid again to search through noise.
If this sounds familiar, you’re not alone.
Why Splunk’s Pricing Makes Teams Want Out
Splunk is the veteran of log management. Nobody disputes that. SPL query language is powerful, dashboards are mature, the third-party integration library is rich. But its business model has a fundamental problem: pricing by log ingestion volume.
This made sense in 2010. Most companies generated maybe a few dozen GB of logs per day. Fast forward to 2026: a mid-sized Kubernetes cluster running a few hundred pods easily produces hundreds of GB, sometimes terabytes daily. Splunk’s per-GB pricing means the healthier your infrastructure scales, the more you pay.
Worse, Splunk’s pricing is opaque. Enterprise quotes go through sales. Discounts vary wildly between customers. Many teams sign thinking the deal is reasonable, then six months later business grows, log volume doubles, and the bill explodes. After Cisco acquired Splunk in 2023, pricing didn’t get friendlier. It made some customers worry it might get worse.
The structural issue is alignment. Splunk’s revenue grows when you send more data. But your business value doesn’t necessarily increase with log volume. A lot of that data is noise: debug statements left on, verbose library logs, health check pings that flood your streams. You’re paying to store and index information nobody will ever query.
Some teams try to game it. They filter logs before sending to Splunk, dropping low-priority streams. But then when something breaks in that filtered service, they’re blind. Or they reduce retention to 7 days instead of 30 to lower storage costs. Then someone needs to investigate a bug that happened two weeks ago and the logs are gone.
So more SREs and CTOs are seriously evaluating Splunk alternatives. Not because Splunk is bad. Because it’s expensive.
SigNoz: OpenTelemetry-Native Open Source Observability
Say you run a 30-person cloud-native team. Tech stack is all Go and Kubernetes. You just wired up tracing with OpenTelemetry. You want one tool to see logs, metrics, and traces together. And you don’t want vendor lock-in.
SigNoz is built for this scenario.
It’s fully open source (Apache 2.0), backed by ClickHouse for storage. Logs, metrics, and traces show up in the same UI with correlation built in. You don’t tab-hop between three separate tools. For teams already running OpenTelemetry SDKs and the Collector, onboarding SigNoz is nearly frictionless. It’s designed around OTel protocols from the ground up.
Query performance is solid. ClickHouse is columnar storage, which naturally handles high-cardinality, high-volume log data well. Community benchmarks show SigNoz often outpaces Elasticsearch on equivalent query loads.
The self-hosted version is completely free with no feature cuts. SigNoz also offers a cloud-hosted version with tiered pricing by data volume. For a team ingesting 50 GB of logs daily, SigNoz Cloud runs roughly one-fifth to one-quarter the cost of Splunk.
Deployment is straightforward for teams comfortable with Docker Compose or Kubernetes. The project provides Helm charts and documented install guides. ClickHouse handles data retention policies through TTL settings, so you can configure different retention for different log streams without building complex pipelines.
One area where SigNoz shines: correlation between signals. You can jump from a trace span directly to the logs emitted during that span. Or from a metric spike to the logs that were generated at that timestamp. This works because everything shares the same underlying data model (OpenTelemetry semantic conventions).
But SigNoz has gaps. The community is active but younger than Elastic or Grafana communities. If you need hundreds of out-of-the-box integrations and parsers, SigNoz’s coverage isn’t there yet. Also, self-hosting a ClickHouse cluster requires some operational skill. Smaller teams might be better off on the cloud version. And if you’re not already using OpenTelemetry, the migration path involves some upfront work to instrument your services.
Elastic Stack: Flexible and Powerful, but Operationally Heavy
You’ve probably used Elasticsearch before. Many teams’ first log system is ELK (Elasticsearch + Logstash + Kibana). It was Splunk’s earliest alternative and still holds the biggest market share in open-source log solutions.
Elastic’s core strength is search. Full-text indexing is in its DNA. Complex log queries, aggregations, pattern recognition: Elastic does them all well. Kibana’s visualization is mature. Dashboards and alert rules can be fine-tuned down to the pixel.
But ELK’s problem is operational complexity.
A production-grade Elasticsearch cluster needs careful shard planning, index lifecycle management, JVM heap tuning, disk watermark configuration. As the cluster scales, you’ll eventually hit split-brain scenarios, shard rebalancing headaches, mapping explosions. Many teams realize the engineering hours they spend keeping ELK running cost as much as Splunk’s invoices.
Here’s a real example: a Series A startup with 50 engineers decided to self-host ELK to save money. They allocated one SRE to manage it. Six months in, that SRE was spending 60% of their time on Elasticsearch: fixing out-of-memory crashes, rebalancing shards after node failures, tuning queries that were timing out. The company wasn’t saving money. They were trading cash for engineering bandwidth.
Elastic’s feature set is deep. If you need security event correlation (Elastic SIEM), threat detection, or anomaly detection powered by machine learning, Elastic is one of the few tools that can do it out of the box. But those features come with complexity. You’ll need someone who understands the platform, not just someone who can write queries.
Elastic has been pushing its own cloud service (Elastic Cloud) to solve the self-hosted operations pain. The cloud version does save headaches, but pricing is steep, especially for multi-region deployments or long retention periods.
One change to note: Elastic shifted its license from SSPL back to AGPL in 2024. For self-hosted users, that’s good news. The community edition is freer to use. But AGPL still has viral clauses. If your product is SaaS and you directly expose Elasticsearch’s functionality, you need to watch compliance.
Elastic’s integrations are deep. Beats agents exist for almost every log source. Logstash has hundreds of input and output plugins. If you need to ingest logs from some obscure enterprise system, chances are someone has already written an Elastic integration for it. This matters more than people think. Building custom parsers takes time.
Who is Elastic for? Mid-to-large teams with dedicated platform engineers, complex query requirements, and a real need for full-text search. If you only have two or three SREs and don’t want to babysit an ES cluster, consider other options.
Grafana Loki: Lightweight Logs Built for Kubernetes
Some teams have a clear need: they’re already using Grafana to watch metrics (via Prometheus). Now they want logs in the same Grafana UI for correlation. Budget is tight, log volume isn’t small, but most queries just filter by label and then read the lines. They don’t need full-text indexing.
Grafana Loki is tailor-made for this.
Loki’s design philosophy is unusual: it doesn’t index log content. It only indexes metadata labels. Storage cost drops dramatically. Log lines get compressed and dumped into object storage (S3, GCS, MinIO). Only labels are indexed. For Kubernetes environments, pod name, namespace, and container name are labels you already have. No extra config needed.
What does this mean in practice? Same 100 GB/day log volume, Loki’s storage cost might be one-tenth of Elasticsearch. Because S3 storage is way cheaper than SSD block storage, and Loki doesn’t build inverted indexes for every log line.
Of course, this design has trade-offs. If you want to search log content for a keyword, Loki has to scan all log chunks in the matching label range. It’s slower than Elasticsearch. For queries like “search all services’ logs over the past 7 days for an error ID,” Loki will lag. But if your usage pattern is “filter by service + time range first, then read the logs,” Loki is plenty fast.
Loki also scales horizontally pretty easily. You can add read replicas for query load, scale up ingesters for write throughput, and the object storage backend grows with you. There’s no shard rebalancing dance like Elasticsearch. When you need more capacity, you add pods.
One gotcha: label cardinality. If you create labels with high-cardinality values (like user IDs or request IDs), Loki’s index will explode in size and performance will tank. The recommended pattern is to keep labels low-cardinality (service, environment, pod) and put everything else in the log line itself.
Loki’s deployment experience in Kubernetes is smooth. Pair it with Promtail or Grafana Alloy (the new-generation collector), install via Helm chart, and you’re collecting logs in minutes. Grafana Labs also offers hosted Loki in Grafana Cloud. The free tier includes 50 GB of logs per month, enough for small teams to get started.
Better Stack: Modern SaaS Experience for Developers
You might not have heard of Better Stack, but you probably heard of Logtail. Better Stack is Logtail’s parent company. After the 2022 brand merge, they integrated uptime monitoring, incident management, and log management into one platform.
Better Stack’s selling point is experience.
Open its log interface and you’ll see what a 2026 product should look like: fast query response, clean UI, smooth live tail, SQL-style query syntax with a low learning curve. It doesn’t have Kibana’s “so many features you need training” vibe or Splunk’s “enterprise but clunky” feel.
The query syntax is approachable. If you know basic SQL, you can write Better Stack queries. No need to learn SPL or Lucene syntax or LogQL. The autocomplete is smart. Type a field name and it suggests values based on your actual data. This makes onboarding new team members fast.
Pricing-wise, Better Stack charges by ingestion volume, but the starting price is low. Free tier gives 1 GB/month. Paid plans start at $29/month with 30-day retention. Compared to Splunk’s tens of thousands per year, that’s friendly for small-to-mid teams. Pricing scales predictably: $99/month for 100 GB, $299/month for 500 GB. No surprise bills.
Better Stack’s S3 archival feature is also useful. Logs past retention automatically archive to your own S3 bucket. When you need them, rehydrate them back for querying. This solves the “compliance requires long retention but we rarely query old logs” problem.
Integration is simple. Better Stack provides agents for major platforms, or you can ship logs via syslog, HTTP, or any standard protocol. The onboarding flow walks you through setup with copy-paste commands. Most teams are ingesting logs within 15 minutes.
The alerting system is straightforward. Define a query, set a threshold, pick a notification channel (Slack, PagerDuty, email, webhooks). No need to learn a separate alerting DSL or configure complex routing rules.
However, Better Stack currently has no open-source version. Data is fully hosted on its infrastructure. For companies with strict data residency requirements, this might be a blocker. Also, its capabilities in complex aggregation analysis and custom parsers aren’t as deep as Elastic or Splunk.
Who should use it? Dev teams under 20 people, startups wanting to spin up log management quickly without operational overhead, teams already using Better Stack for uptime monitoring.
Axiom: Data Lake Architecture for Long-Term Storage
Some scenarios don’t just need logs from the past few days. Finance requires 7-year log retention. Healthcare might need longer. In these cases, traditional log systems’ “hot storage” model gets expensive fast. You can’t keep 7 years of logs on Elasticsearch’s SSDs.
Axiom takes a different approach: it treats logs as a data lake. All ingested data is immediately compressed, partitioned, and stored in object storage. Queries run through a custom columnar query engine that scans object storage directly. No pre-built indexes.
This means Axiom’s storage cost is very low, especially for long-term retention. Storing 1 TB of logs for a year in Axiom might cost one-tenth of Splunk. And data is queryable as soon as it arrives. You don’t need to define schemas or design index mappings upfront.
Axiom’s query language is APL (Axiom Processing Language), syntax similar to KQL (Kusto Query Language). If you’ve used Azure Data Explorer, it’ll feel familiar. Query speed over large time ranges performs well because columnar storage naturally suits “scan lots of data, aggregate a few fields” workloads.
Axiom’s strength shows up when you need to answer questions like “what were the top error messages across all services over the past 90 days?” or “show me the traffic pattern for this endpoint over the last 6 months.” Traditional log systems would either time out or cost a fortune to query that much historical data. Axiom handles it without breaking a sweat.
Data residency options exist for enterprise customers. Axiom can deploy dedicated clusters in specific regions if you have regulatory requirements. But the base tier runs on their multi-tenant infrastructure, which means you’re trusting them with your log data.
But Axiom’s real-time capability lags behind dedicated log search tools. From ingestion to queryable, expect a few seconds to tens of seconds of delay. If your scenario is “incident happens, need to see the latest logs immediately,” this latency might frustrate you. Also, Axiom is currently pure SaaS with no self-hosted option.
Who should use it? Compliance-driven log retention (finance, healthcare, government), long-term analysis of large log volumes (security audits, user behavior retrospectives), teams that don’t need millisecond real-time queries.
Core Comparison: Choosing Among Five Splunk Alternatives
After all that, here’s the key info in one table:
| Dimension | SigNoz | Elastic Stack | Grafana Loki | Better Stack | Axiom |
|---|---|---|---|---|---|
| License | Open source (Apache 2.0) | Open source (AGPL) + commercial | Open source (AGPL) + commercial | Pure commercial SaaS | Pure commercial SaaS |
| Deployment | Self-hosted / cloud | Self-hosted / cloud | Self-hosted / cloud | Pure SaaS | Pure SaaS |
| Starting price | Self-hosted free; cloud $199/mo | Self-hosted free; cloud $95/mo+ | Self-hosted free; cloud free 50GB/mo | Free 1GB/mo; $29/mo+ | Free 500MB/mo; $25/mo+ |
| Default retention | Custom (disk-dependent) | Custom (ILM managed) | Custom (object storage unlimited) | 30 days (extendable) | 30 days (custom on enterprise) |
| Full-text search | Yes | Strong suit | No (label-only indexing) | Yes | Yes |
| Best fit | OTel-native teams, logs+traces correlation | Complex queries, security analysis | K8s environments, low-cost high-volume | Quick setup, dev experience | Compliance long-term storage, large archives |
This table gives you a quick reference. But tool selection shouldn’t be parameter-driven alone. Here are more specific suggestions by team situation.
Choosing a Log Platform by Team Size and Scenario
5-20 person startup, tight budget: Better Stack or Grafana Loki (cloud version). The former is zero-ops, the latter has a free tier and plugs directly into the Grafana stack. At this stage, don’t spend time on infrastructure ops. Focus on product.
20-100 person growth-stage team with existing Kubernetes and Prometheus: Grafana Loki + SigNoz are both solid options. If you’re already using Grafana for metrics, Loki is the natural extension. If you want unified logs+traces experience, SigNoz fits better. Both can be self-hosted to control cost.
100+ person mid-to-large team with a platform engineering group: Elastic comes back into consideration. You have the headcount to run clusters and need Elastic’s advanced features (security analytics, anomaly detection, machine learning). But if your main need is log viewing and alerting, Elastic might be overkill.
Enterprise with compliance requirements and long-term log retention: Axiom is purpose-built for this. Data lake architecture keeps long-term storage costs manageable. The query engine is optimized for large time-range scans. If data must stay within specific jurisdictions, evaluate whether Axiom’s data center locations meet your requirements.
Teams all-in on OpenTelemetry: SigNoz is currently the most OTel-native experience. It has specialized optimizations for OTel Collector log ingestion. Trace-log correlation happens in the same interface with no tab-hopping.
Real Considerations When Migrating from Splunk
One topic many care about but hesitate to mention: migration pain.
Use Splunk long enough and your team accumulates hundreds of SPL queries, custom dashboards, alert rules. These don’t migrate with a button click. Each alternative has different query syntax. Kibana dashboards and Grafana dashboards have different logic.
A pragmatic approach is gradual migration. Dual-write new logs to the new platform. Run it for a week or two to validate query experience and performance. Leave old data in Splunk until it expires. Rebuild and validate critical alert rules in the new platform. Once the team is comfortable, gradually shut off Splunk ingestion.
This process typically takes one to three months, depending on how much custom logic you’ve built on Splunk. But the good news: most teams see log infrastructure costs drop 50% to 80% after migration completes.
Some practical tips for migration:
Start with one service or team as a pilot. Pick something non-critical but active enough to generate real usage patterns. This gives you feedback without risking production stability.
Document the top 10 queries your team runs in Splunk. Translate them to the new platform’s query language and compare results. This catches semantic differences early. SPL’s “stats” command might not map exactly to Elasticsearch’s aggregations or Loki’s LogQL.
Plan for alert rule migration separately. Alerting logic is often where teams have invested the most customization. Some alerts might need rethinking in the new platform. That’s not a bad thing. It’s a chance to revisit whether those alerts still make sense.
Budget for training. Even if the new tool is simpler, your team needs time to learn it. Set aside a few hours for each engineer to explore the UI, write queries, build dashboards. Don’t assume people will figure it out on their own during incidents.
What About Hybrid Approaches?
Some teams don’t pick one tool. They run multiple log systems for different use cases.
For example: Grafana Loki for application logs (high volume, low retention), Better Stack for critical service logs (low volume, high visibility), and Axiom for audit logs (compliance-driven, long retention). Each tool handles what it’s best at. The operational overhead is higher, but the cost savings can justify it.
This works when you have clear boundaries between log types and the team has enough maturity to manage multiple systems. If you’re a 10-person startup, stick to one tool. If you’re a 200-person company with a dedicated platform team, hybrid might make sense.
The Hidden Costs Nobody Talks About
When evaluating Splunk alternatives, most teams focus on the sticker price. But there are costs beyond the invoice.
Operational overhead is real. Self-hosting Elastic or Loki means someone needs to monitor the log system itself, handle upgrades, tune performance. That’s engineer time. If your SRE team is already stretched thin, SaaS starts looking more attractive even if it costs more per GB.
Learning curve matters. Moving from Splunk to any alternative means your team needs to relearn query syntax, dashboard building, alerting. During that transition, productivity drops. Factor that in.
Data egress can bite you. If you’re running on AWS and your log system is outside AWS, you’ll pay data transfer fees. Some teams save 50% on log storage costs but then blow it all on egress charges.
Vendor risk is different but still real. With Splunk, you know they’ll be around in 5 years (Cisco backing them). With a younger startup like SigNoz or Axiom, there’s more uncertainty. That might not matter for logs, but it’s something to weigh.
Making the Decision
There’s no perfect log tool. Splunk is expensive but powerful. Open-source solutions are cheap but need operational investment. SaaS options are hands-off but your data lives with someone else. Which you pick depends on what your team lacks most right now: money, people, or time. Answer that question clearly, and the choice becomes obvious.
If you’re still unsure, here’s a forcing function: calculate your current Splunk spend per month. Then calculate how many engineering hours you’d need to self-host an alternative. Use your engineers’ fully-loaded cost (salary + benefits + overhead, usually 1.5x to 2x base salary). If self-hosting costs less than 50% of Splunk, it might be a win. If it’s 80% or more, stick with SaaS.
And remember: you can always change your mind later. Logs aren’t like databases. They’re ephemeral. If you pick a tool and it doesn’t work out, you can switch again without data migration drama. That’s the nice thing about observability infrastructure. It’s replaceable.
Stay updated with our latest AI insights