It’s 2:47 AM. PagerDuty fires a P1. Error rates on a core microservice just hit 12%. You open your laptop, log into Splunk Cloud, run a query, wait eight seconds for results. Twenty minutes to find the root cause (a downstream dependency timeout), ten minutes to fix it. Back in bed by 3:30.
Next morning you check your Splunk usage dashboard. This month’s log ingestion is 35% over your contract limit. The overage billing estimate: an extra $15,000. The irony? That overnight P1 only involved a few hundred useful log lines. The rest was debug noise. You paid to store noise, then paid again to search through it.
If this sounds familiar, you’re not alone.
Why teams leave Splunk
Splunk is the incumbent for a reason. SPL is powerful, the dashboards are mature, the ecosystem is deep. But the business model has a structural problem: pricing by ingestion volume.
This made sense in 2012 when most companies generated tens of gigabytes of logs per day. In 2025, a mid-size Kubernetes cluster running a few hundred pods can easily produce hundreds of gigabytes daily. Splunk’s per-GB pricing means your bill grows in lockstep with your infrastructure, even when that growth is healthy.
The pricing is also opaque. Enterprise quotes go through sales, discounts vary wildly between customers, and many teams sign a contract that feels reasonable, only to watch their bill double six months later when traffic grows. Cisco’s 2023 acquisition hasn’t made pricing more predictable.
So more SRE leads and engineering VPs are running serious evaluations of alternatives. Not because Splunk is bad software. Because the economics don’t scale.
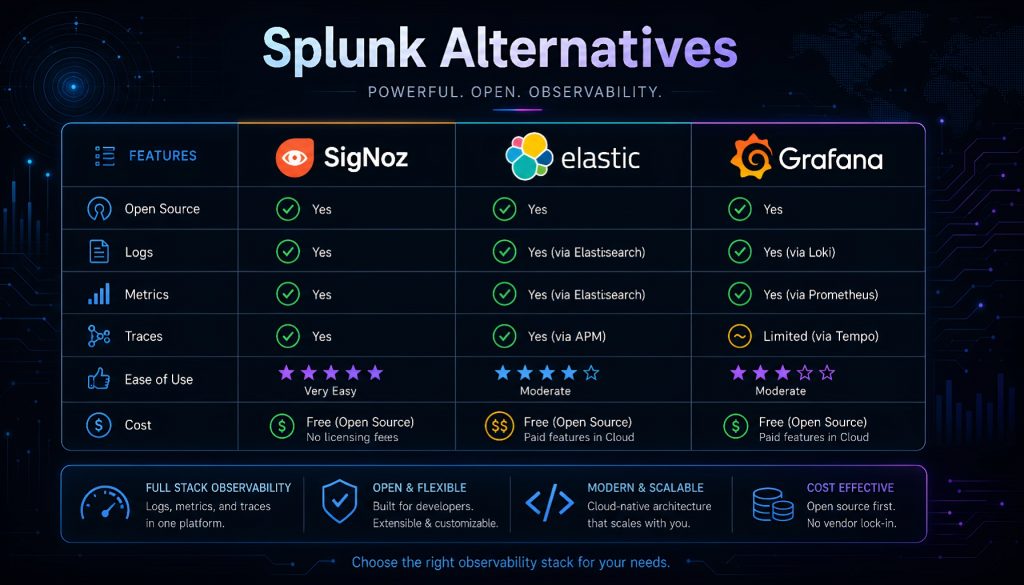
SigNoz: built for OpenTelemetry-native teams
If your stack is Go, Kubernetes, and you’ve already instrumented with OpenTelemetry, SigNoz deserves a close look.
SigNoz is a fully open-source observability platform (Apache 2.0) built on ClickHouse. Logs, metrics, and traces live in one interface with native correlation. For teams already running OTel Collectors, the integration is nearly zero-friction since SigNoz was designed around the OTel protocol from the start.
Query performance is strong. ClickHouse’s columnar storage handles high-cardinality log data well, and community benchmarks consistently show SigNoz outperforming Elasticsearch on equivalent datasets.
The self-hosted version is free with no feature gating. The managed cloud version uses tiered pricing that starts well below Splunk. For a team ingesting 50 GB/day, SigNoz Cloud typically runs one-fourth to one-fifth of what Splunk charges.
Where it falls short: The ecosystem is younger than Elastic or Grafana. If you need hundreds of pre-built parsers for exotic data sources, coverage is thinner. And self-hosting a ClickHouse cluster requires real operational skill. Smaller teams may want the cloud version.
Elastic Stack: powerful search, heavy operational lift
You’ve probably run ELK before. Many teams’ first log system was Elasticsearch + Logstash + Kibana. It’s still the largest open-source log platform by market share and remains the strongest option for full-text search and complex aggregations.
Kibana’s visualization layer is mature. Dashboards, alerting rules, anomaly detection, machine learning features for security analytics. If your queries are complex and varied, Elastic handles them well.
The catch is operational complexity.
A production Elasticsearch cluster requires careful planning around shard strategy, index lifecycle management, JVM heap sizing, and disk watermarks. At scale, you’ll encounter split brain events, shard rebalancing storms, and mapping explosions. Many teams discover that the engineering hours spent maintaining ELK cost roughly the same as Splunk’s license fees.
Elastic Cloud (the managed offering) solves the ops burden but isn’t cheap, especially for multi-region deployments or long retention windows.
One positive development: Elastic switched its license back to AGPL in 2024, which is friendlier for self-hosted users than the previous SSPL. But AGPL still has copyleft implications if your SaaS product directly exposes Elasticsearch functionality.
Best fit: Mid-to-large teams with dedicated platform engineers, complex search requirements, and security analytics use cases. If you have two SREs and don’t want to spend half their time babysitting an ES cluster, look elsewhere.
Grafana Loki: lightweight logging for Kubernetes environments
Some teams have a specific situation: they already use Grafana for metrics via Prometheus, they want logs in the same interface, their budget is tight, and most of the time they just need to filter by labels and read the output. They don’t need full-text indexing.
Loki was designed for exactly this.
Its core design choice is radical: it indexes only metadata labels, not log content. Log bodies get compressed and stored directly in object storage (S3, GCS, MinIO). For Kubernetes workloads, the labels (pod name, namespace, container) already exist. No extra configuration needed.
The cost difference is dramatic. For 100 GB/day of logs, Loki’s storage costs roughly one-tenth of Elasticsearch’s. Object storage is far cheaper per GB than SSD block storage, and skipping full-text indexing eliminates the processing overhead.
The tradeoff: searching for a specific string across all services over seven days requires scanning all matching log chunks. That’s slow compared to Elasticsearch. But if your typical workflow is “narrow by service and time range first, then read the logs,” Loki handles that fine.
Deployment in Kubernetes is smooth. Promtail or Grafana Alloy (the newer collector) plus a Helm chart gets you running in minutes. Grafana Cloud offers a hosted Loki with a free tier of 50 GB/month, which is enough for small teams to start without spending anything.
Best fit: Teams already invested in the Grafana/Prometheus stack, Kubernetes-heavy environments, cost-sensitive orgs with high log volume but straightforward query patterns.
Better Stack: modern SaaS experience for small teams
Better Stack (formerly Logtail) merged uptime monitoring, incident management, and log management into a single platform in 2022. Its main selling point is developer experience.
The log interface feels like a product built in 2025. Queries return fast, the UI is clean, live tail streams smoothly, and the SQL-based query syntax has a low learning curve. It doesn’t have Kibana’s “you need training to use this” complexity or Splunk’s enterprise weight.
Pricing starts low. Free tier at 1 GB/month, paid plans from $29/month with 30-day retention. Compared to Splunk’s five-figure annual contracts, this is accessible for small teams.
The S3 archival feature solves a common compliance problem: logs past their retention window automatically archive to your own S3 bucket and can be rehydrated when needed. Good for regulatory requirements that demand long retention without frequent access.
Limitations: No open-source version, data lives entirely on their infrastructure. For organizations with data residency requirements (especially in regulated industries or specific jurisdictions), this may be a blocker. Advanced aggregation and custom parser capabilities don’t match Elastic or Splunk depth.
Best fit: Teams under 20 engineers, startups that want fast setup without operational overhead, organizations already using Better Stack for uptime monitoring.
Axiom: data lake architecture for long-term retention
Some industries can’t delete logs. Financial services require 7-year retention. Healthcare may need longer. Storing seven years of logs in Elasticsearch’s hot storage tier costs a fortune.
Axiom takes a different approach: it treats logs as a data lake. All incoming data gets compressed, partitioned, and stored in object storage immediately. Queries run through a custom columnar engine that scans object storage directly without pre-built indexes.
The result: storage costs for long-term retention are roughly one-tenth of Splunk’s. Data is queryable on arrival with no schema definition or index design required upfront.
Axiom’s query language, APL (Axiom Processing Language), resembles KQL (Kusto Query Language). If you’ve used Azure Data Explorer, the syntax will feel familiar. Query performance over large time ranges is solid since columnar storage is well-suited to “scan many rows, aggregate few columns” workloads.
Tradeoffs: Ingestion-to-queryable latency runs a few seconds to ~15 seconds. If your incident response workflow requires seeing logs the instant they’re produced, that gap may be uncomfortable. Axiom is also SaaS-only with no self-hosted option.
Best fit: Compliance-driven retention (finance, healthcare, government), high-volume archival with periodic analytical queries, security audit trails, teams that don’t need sub-second real-time log tailing.
Comparison table
| Dimension | SigNoz | Elastic Stack | Grafana Loki | Better Stack | Axiom |
|---|---|---|---|---|---|
| License | Open source (Apache 2.0) | Open source (AGPL) + commercial | Open source (AGPL) + commercial | Commercial SaaS | Commercial SaaS |
| Deployment | Self-hosted or cloud | Self-hosted or cloud | Self-hosted or cloud | SaaS only | SaaS only |
| Pricing entry point | Self-hosted free; cloud from $199/mo | Self-hosted free; Cloud from $95/mo | Self-hosted free; Cloud free 50 GB/mo | Free 1 GB/mo; from $29/mo | Free 500 MB/mo; from $25/mo |
| Default log retention | Custom (disk-dependent) | Custom (ILM-managed) | Custom (object storage, unlimited) | 30 days (extendable on paid plans) | 30 days (enterprise plans customizable) |
| Full-text search | Yes | Core strength | No (label-index only) | Yes | Yes |
| Query language | ClickHouse SQL | KQL / Lucene | LogQL | SQL-based | APL (KQL-like) |
| Best scenario | OTel-native teams, log-trace correlation | Complex queries, security analytics | K8s environments, high volume at low cost | Fast setup, developer experience | Compliance retention, large-scale archival |
Picking the right tool by team size and situation
5-20 engineers, tight budget: Better Stack or Grafana Loki (Cloud). Better Stack requires zero ops work. Loki’s free tier integrates directly with your existing Grafana setup. At this stage, don’t spend engineering hours running infrastructure. Ship product.
20-100 engineers, already on Kubernetes and Prometheus: Loki and SigNoz are both strong choices. If Grafana is already your metrics dashboard, Loki is the natural extension. If you want unified logs-traces-metrics in a single pane, SigNoz fits better. Both can be self-hosted to control costs.
100+ engineers with a platform team: Elastic re-enters the picture. You have the headcount to operate the cluster and you may need its advanced capabilities (security analytics, ML-based anomaly detection). But if your primary need is log viewing and alerting, Elastic may be more than you need.
Compliance-driven long retention (finance, healthcare, government): Axiom was purpose-built for this. The data lake model keeps long-term storage costs manageable. Verify that their data center locations satisfy your residency requirements.
All-in on OpenTelemetry: SigNoz is the closest match to an OTel-native workflow. Its log ingestion is optimized for OTel Collector output, and trace-to-log correlation happens in one interface without context switching.
Migrating from Splunk: what to expect
The hardest part of leaving Splunk isn’t picking a replacement. It’s the accumulated SPL queries, custom dashboards, and alerting rules that your team built over months or years. None of that transfers with a button click. Every alternative uses a different query language, and Kibana dashboards don’t map 1:1 to Grafana panels.
A practical approach: dual-write new logs to both Splunk and the replacement platform for one to two weeks. Evaluate query performance and workflow fit on real data. Let old data age out of Splunk naturally. Rebuild critical alerts on the new platform and validate them before cutting over. Once the team is comfortable, stop sending data to Splunk.
This process typically takes one to three months depending on how much custom logic you’ve accumulated. The payoff: most teams report 50% to 80% lower infrastructure costs for log management after completing the migration.
No perfect answer
Splunk is expensive but undeniably capable. Open-source alternatives are cheaper but demand operational investment. SaaS options reduce ops work but put your data on someone else’s infrastructure. The right choice depends on what your team is shortest on right now: budget, headcount, or time. Clarify that constraint first, and the decision follows.
Stay updated with our latest AI insights