It’s 2:47 AM. PagerDuty fires a P1 alert because a core microservice just hit a 12% error rate. You open your laptop, log into Splunk Cloud, run a query, and wait eight seconds for results. Twenty minutes to find the root cause, ten more to patch it. You’re back in bed by 3:30.
The next morning you check Splunk’s usage dashboard. This month’s ingestion already exceeds your contract by 35%. The overage bill adds up to thousands of dollars. And that P1 incident? It came down to a downstream dependency timeout. Only a few hundred log lines mattered. The rest was debug noise you paid to store, then paid again to query.
If this sounds familiar, you’re not alone. Engineering teams across the industry are re-evaluating their Splunk spend, not because the product is bad, but because the pricing model punishes infrastructure growth.
Why Teams Are Leaving Splunk
Splunk dominates log management for good reason. SPL is powerful, dashboards are mature, and the ecosystem runs deep. But the commercial model has a structural problem: billing by ingestion volume.
That logic made sense in 2012 when most companies generated tens of gigabytes per day. In 2026, a mid-sized Kubernetes cluster running a few hundred pods produces hundreds of gigabytes or even terabytes daily. Per-GB pricing means your bill grows linearly with healthy infrastructure scaling.
Pricing transparency makes this worse. Enterprise quotes require a sales call, discounts vary wildly between customers, and many teams sign contracts that feel reasonable until log volume doubles six months later. Cisco’s 2023 acquisition of Splunk hasn’t made pricing friendlier, and some customers worry it will get more expensive.
The result: SREs and engineering leaders are running serious evaluations of alternatives. The motivation is economics, not dissatisfaction with Splunk’s capabilities.
SigNoz: OpenTelemetry-Native Observability
Consider a 30-person cloud-native team running Go services on Kubernetes. They’ve already instrumented tracing with OpenTelemetry and want a single tool for logs, metrics, and traces without vendor lock-in.
SigNoz was built for exactly this scenario.
It’s a fully open-source (Apache 2.0) observability platform backed by ClickHouse for storage. Logs, metrics, and traces live in one interface with cross-signal correlation. Teams already using OpenTelemetry SDKs and Collectors can plug into SigNoz with minimal friction because the platform was designed around the OTel protocol from the start.
Query performance is strong. ClickHouse’s columnar storage gives it a natural advantage for high-cardinality, high-volume log data. Community benchmarks consistently show SigNoz outperforming Elasticsearch on equivalent datasets.
The self-hosted version is free with no feature gating. SigNoz Cloud uses tiered pricing starting well below Splunk’s rates. For a team ingesting 50GB/day, SigNoz Cloud typically costs one-fifth to one-quarter of what Splunk charges.
The tradeoffs are real, though. SigNoz’s community is active but younger than Elastic or Grafana ecosystems. If you need hundreds of pre-built source parsers and integrations, coverage is thinner than established players. Self-hosting a ClickHouse cluster also requires operational expertise, so smaller teams may prefer the managed cloud option.
Elastic Stack: Powerful Search, Heavy Operations
You’ve probably used Elasticsearch already. Many teams built their first log pipeline on ELK (Elasticsearch, Logstash, Kibana), making it the largest open-source log management deployment base and Splunk’s earliest challenger.
Elastic’s core strength is search. Full-text retrieval is in its DNA: complex log queries, aggregation analysis, pattern detection all work well. Kibana’s visualization layer is mature, and dashboards plus alert rules can be configured with precision.
The challenge is operational complexity.
A production Elasticsearch cluster requires careful planning of shard strategies, index lifecycle policies, JVM heap sizing, and disk watermarks. As clusters grow, split-brain scenarios, shard rebalancing storms, and mapping explosions start appearing. Many teams eventually realize the engineering hours spent maintaining ELK, when converted to cost, rival Splunk’s invoice.
Elastic Cloud (the managed offering) solves some operational pain, but pricing remains steep for cross-region deployments or long-term retention. On the licensing front, Elastic moved back to AGPL in 2024, which benefits self-hosted users but introduces copyleft considerations for SaaS products that expose Elasticsearch functionality directly.
Best fit: Mid-to-large teams with dedicated platform engineers, complex query requirements, and a need for full-text search. If you only have two or three SREs and don’t want to spend cycles babysitting an ES cluster, look elsewhere.
Grafana Loki: Built for Kubernetes, Optimized for Cost
Some teams have a clear requirement: they already use Grafana for metrics via Prometheus and want logs in the same interface. Budget is limited, log volume is high, and most queries follow a pattern of filtering by labels first, then reading content. Full-text indexing isn’t necessary.
Grafana Loki was designed for this exact workflow.
Loki’s architecture is distinctive: it indexes only metadata labels, not log content. Log bodies get compressed and written directly to object storage (S3, GCS, MinIO) while only labels are indexed. In Kubernetes environments, pod name, namespace, and container name exist as labels by default with zero extra configuration.
The cost implications are significant. For 100GB/day of logs, Loki’s storage costs can be one-tenth of Elasticsearch’s because S3 pricing is far cheaper than SSD block storage, and Loki skips building inverted indexes for every log line.
This design has a corresponding tradeoff. Searching for a keyword inside log content requires scanning all log chunks within the matched label range, which is slower than Elasticsearch. A query like “find this error ID across all services over the past 7 days” will be noticeably slow on Loki. But if your usage pattern is “narrow by service and time range first, then read logs,” Loki handles it well.
Deployment in Kubernetes is smooth. Pair it with Promtail or Grafana Alloy (the next-generation collector), deploy via Helm chart, and you’re collecting logs within minutes. Grafana Cloud offers a managed Loki instance with a free tier of 50GB/month, enough for small teams to get started.
Better Stack: Modern SaaS With Developer-First UX
You may not have heard of Better Stack, but you’ve likely encountered Logtail. Better Stack is Logtail’s parent company. After a 2022 brand consolidation, they merged uptime monitoring, incident management, and log management into one platform.
Better Stack’s differentiator is experience.
The log interface feels like a product built in 2026: fast query responses, clean UI, smooth live tail streaming, and a SQL-like query syntax with a low learning curve. It avoids Kibana’s “needs training to use” density and Splunk’s enterprise weight.
Pricing starts low. The free tier includes 1GB/month, paid plans begin at $29/month with 30-day retention. Compared to Splunk’s five-figure annual contracts, this is accessible for small and mid-size teams.
The S3 archival feature deserves mention. Logs past their retention window automatically archive to your own S3 bucket and can be rehydrated for queries when needed. This addresses compliance requirements where long retention is mandated but historical data is rarely accessed.
Better Stack has no open-source version, and data lives entirely on their infrastructure. For organizations with data residency requirements, this could be a blocker. Complex aggregation and custom parser capabilities also don’t run as deep as Elastic or Splunk.
Best fit: Teams under 20 engineers who want fast setup without operational overhead, startups that need log management running in minutes, and teams already using Better Stack for uptime monitoring.
Axiom: Data Lake Architecture for Long-Term Retention
Some scenarios demand more than a few days of log visibility. Financial services require 7-year retention. Healthcare may need longer. Traditional log systems with hot storage models become prohibitively expensive at that scale because you can’t keep 7 years of logs on Elasticsearch SSDs.
Axiom takes a different approach: it treats logs as a data lake. All ingested data gets compressed, partitioned, and written to object storage immediately. Queries run through a custom columnar engine that scans object storage directly without pre-built indexes.
Storage costs drop dramatically, especially for long-term retention. Storing 1TB of logs for one year on Axiom can cost one-tenth of the equivalent Splunk bill. Data is queryable on arrival with no schema definition or index design required upfront.
Axiom’s query language, APL (Axiom Processing Language), follows KQL (Kusto Query Language) syntax. Teams familiar with Azure Data Explorer will feel at home. Query speed over large time ranges performs well because columnar storage naturally suits “scan many rows, aggregate few columns” patterns.
The latency tradeoff: ingestion to queryability typically takes a few seconds to roughly ten seconds. For “production is down, show me the latest logs right now” scenarios, that delay may be uncomfortable. Axiom is also SaaS-only with no self-hosted option currently available.
Best fit: Compliance-driven retention (financial, healthcare, government), high-volume log archival for security audits and behavioral analysis, and teams where sub-second query freshness isn’t critical.
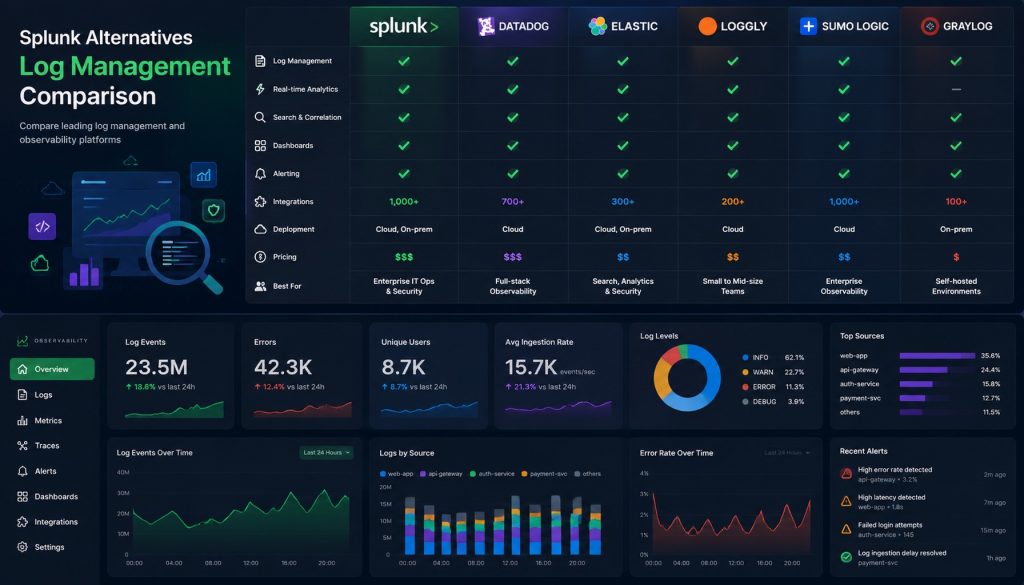
Comparison Table
| Dimension | SigNoz | Elastic Stack | Grafana Loki | Better Stack | Axiom |
|---|---|---|---|---|---|
| License | Open source (Apache 2.0) | Open source (AGPL) + commercial | Open source (AGPL) + commercial | Commercial SaaS | Commercial SaaS |
| Deployment | Self-hosted / Cloud | Self-hosted / Cloud | Self-hosted / Cloud | SaaS only | SaaS only |
| Starting price | Self-hosted free; Cloud $199/mo | Self-hosted free; Cloud from $95/mo | Self-hosted free; Cloud free 50GB/mo | Free 1GB/mo; from $29/mo | Free 500MB/mo; from $25/mo |
| Default retention | Custom (disk-dependent) | Custom (ILM-managed) | Custom (object storage, unlimited) | 30 days (extendable on paid plans) | 30 days (enterprise customizable) |
| Full-text search | Yes | Core strength | No (label-index only) | Yes | Yes |
| Best scenario | OTel-native teams, log-trace correlation | Complex queries, security analytics | K8s environments, high-volume low-cost | Fast setup, developer UX | Compliance retention, large-scale archival |
Choosing by Team Size and Context
5-20 engineers, tight budget: Better Stack or Grafana Loki (Cloud). Better Stack gives you zero-ops immediate access. Loki Cloud provides a generous free tier and integrates seamlessly with the Grafana ecosystem. At this stage, don’t spend engineering time on infrastructure operations. Spend it on the product.
20-100 engineers, established Kubernetes and Prometheus stack: Grafana Loki and SigNoz are both strong choices. If you already run Grafana for metrics, Loki is the natural extension. If you want unified logs-and-traces in a single pane, SigNoz fits better. Both support self-hosting to keep costs controlled.
100+ engineers, dedicated platform team: Elastic re-enters the picture. You have the headcount to operate clusters, and you may need advanced features like security analytics, anomaly detection, or ML-based alerting. But if the primary requirement is log viewing and alerting, Elastic may be heavier than necessary.
Compliance-driven long-term retention: Axiom is purpose-built for this. Its data lake architecture keeps long-term storage affordable, and the query engine is optimized for scanning large time ranges. Confirm that Axiom’s data center locations satisfy your residency requirements before committing.
All-in on OpenTelemetry: SigNoz is currently the most OTel-native option available. It has specific optimizations for OTel Collector log ingestion, and trace-to-log correlation happens in a single interface without context switching.
Practical Migration Guidance
Switching away from Splunk involves real friction. Teams accumulate SPL queries, custom dashboards, and alert rules over years. None of that transfers with a single click because each alternative uses a different query language and dashboard model.
The pragmatic approach is incremental migration:
- Dual-write new logs to the target platform while keeping Splunk active.
- Run both systems in parallel for one to two weeks. Validate query performance, coverage, and alerting behavior on the new platform.
- Leave historical data in Splunk until retention expiry. Don’t pay for backfill migration unless compliance requires it.
- Rebuild critical alert rules on the new platform and verify they trigger correctly.
- Once the team is comfortable with the new tool, stop Splunk ingestion.
This process typically takes one to three months depending on how much custom logic exists in your Splunk deployment. The payoff: most teams report 50% to 80% reduction in log infrastructure costs after completing the switch.
The Decision Framework
No log management tool is perfect. Splunk is expensive but well-built. Open-source options cost less in licensing but demand operational investment. SaaS alternatives reduce operational load but put your data on someone else’s infrastructure.
The question that clarifies the decision: what does your team lack most right now? If it’s budget, prioritize low-cost options like Loki or SigNoz self-hosted. If it’s engineering bandwidth, pick a managed SaaS. If it’s time-to-value, go with whichever tool integrates fastest into your existing stack.
Match the tool to the constraint, and the choice becomes straightforward.
Stay updated with our latest AI insights