A developer on your team tagged pod names as metric labels last sprint. Cardinality exploded to 47,000 time series at $0.05 each. The bill landed on a Monday morning, and suddenly your observability spend is 15% of your engineering payroll.
This story plays out every quarter at Series A startups running 20 to 50 hosts. Datadog is a great product. It’s also priced for enterprises with enterprise budgets. A full-stack observability setup across 50 hosts easily runs $27,000 per year, and that number only moves in one direction.
So you start looking for alternatives. The problem isn’t finding options. The problem is figuring out which one actually fits a team of 10 to 50 engineers who need real observability, not a downgrade.
I’ve spent the past three months evaluating five tools that keep showing up in these conversations: Grafana Cloud, Better Stack, SigNoz, Axiom, and Uptrace. Here’s what I found.
What Small Teams Actually Need in 2026
The Prometheus-plus-Grafana-dashboards era is over. You can’t get away with metrics in one tool, logs in another, and no tracing at all.
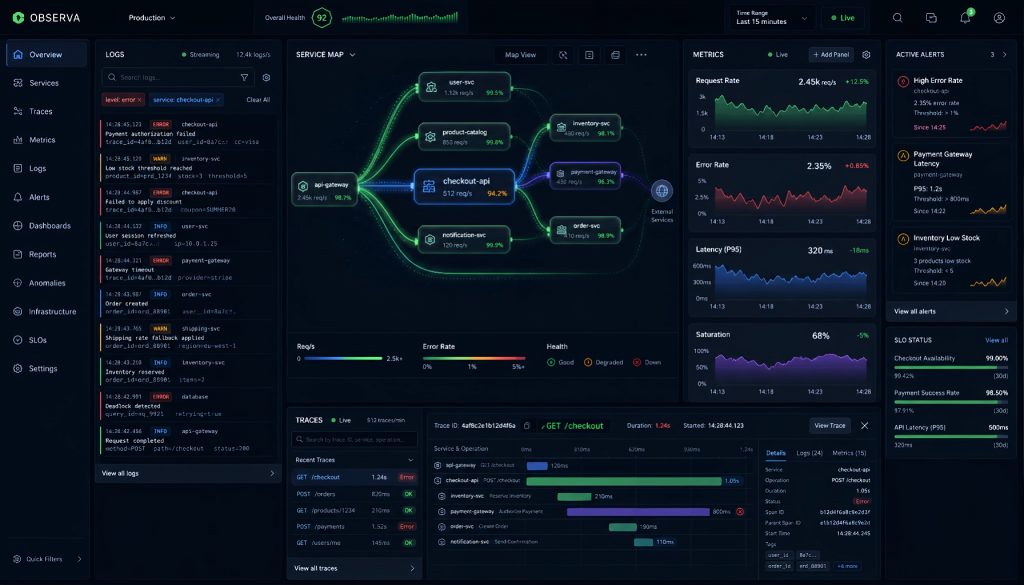
Modern observability means three-signal correlation. You see CPU spike in your metrics, jump to the request trace that caused it, then read the error log that explains why. That connected workflow is where the value lives. Without it, you’re just staring at disconnected charts during a 2 AM incident.
OpenTelemetry has become the default standard. OTLP is to telemetry what HTTP is to the web. Any tool that doesn’t support OTel natively in 2026 is a red flag, because it means vendor lock-in through proprietary agents. You want your instrumentation to outlive your backend choice.
With that context, here’s how the five contenders stack up.
Grafana Cloud: The Ecosystem Play
Grafana Labs spent a decade building the best open-source visualization platform, then wrapped managed backends around it. Grafana Cloud gives you Prometheus for metrics, Loki for logs, and Tempo for traces, all behind the familiar Grafana UI.
The free tier is actually usable for small production workloads: 10,000 active metric series, 50 GB of logs, 50 GB of traces, 14 days of retention. Three users, no credit card required.
The strength here is ecosystem breadth. Your team has probably already built Grafana dashboards somewhere. Hundreds of community integrations exist for every database, message queue, and cloud service you’re running. The open-source foundation means no lock-in on the data layer.
The tradeoff is complexity. You’re managing multiple backends conceptually, even if Grafana Labs handles the infrastructure. Alert rules live in different places depending on signal type. The learning curve is steeper than a single-pane SaaS product, and initial setup takes more decisions than just dropping in an API key.
Best for: Teams already invested in the Grafana/Prometheus ecosystem who want a managed upgrade path without rearchitecting.
Better Stack: Developer Experience as a Feature
Better Stack combines uptime monitoring, log management, and incident response into one product. The interface feels like Linear built an observability tool. Clean, fast, opinionated.
Log search is remarkably quick thanks to ClickHouse underneath. The built-in status page, alerting, on-call scheduling, and incident management form a complete workflow. You don’t need PagerDuty alongside it. You don’t need a separate status page service. It’s all there.
Paid plans start at $24 per month. The free tier is limited but lets you experience the full feature set.
Where Better Stack falls short is custom metrics. If your team writes complex PromQL queries or needs high-cardinality metric exploration, this isn’t the right fit. It prioritizes simplicity over power-user flexibility.
Best for: Small teams that want fast setup, beautiful DX, and an integrated incident workflow without stitching together four different SaaS products.
SigNoz: Open Source, Full Stack, Self-Hosted Savings
SigNoz is the only open-source project that puts logs, metrics, and traces into a single codebase. Built on ClickHouse, query performance is strong even at scale.
The economics are straightforward. Self-host it and you pay only for compute. No per-host fees, no per-GB ingestion charges, no retention surcharges. For a team with DevOps capacity, the savings are dramatic compared to any hosted alternative.
If you don’t want to run infrastructure, SigNoz Cloud exists and typically costs 60 to 80 percent less than equivalent Datadog plans.
The downsides are real. The community is smaller than Grafana’s. The plugin ecosystem is thinner. Enterprise features like SSO and granular RBAC sit behind the paid tier. Documentation exists but has gaps compared to what Datadog or Grafana publish.
Best for: Teams with ops capability who want full control over their observability stack and refuse to pay per-host pricing.
Axiom: Infinite Retention Without the Invoice Shock
Axiom’s differentiator is simple: data retention doesn’t cost extra. While competitors charge by retention days (want 90 days instead of 14? Pay up.), Axiom separates ingestion cost from storage duration.
The architecture is serverless. No per-host pricing model at all. You pay for what you ingest and query, period.
The free tier offers 500 GB of ingestion per month with 30 days of retention. That covers most small teams comfortably.
The weakness is signal coverage. Tracing support exists but lags behind dedicated tracing backends. Metric capabilities don’t match what Prometheus-native tools offer. If you need deep metric exploration with complex aggregation queries, Axiom won’t satisfy you.
Best for: Teams with high log volumes, infrequent queries, or compliance requirements that demand long-term data archival without budget blowout.
Uptrace: Born for OpenTelemetry
Uptrace was built from day one around OpenTelemetry. No proprietary agents, no custom SDKs, no format conversion. If your application already exports OTLP data, Uptrace accepts it without friction.
Pricing is volume-based and transparent. Typical costs run 5 to 10 times cheaper than Datadog for equivalent data volumes.
The risks are clear too. Brand recognition is low. The community is small. Documentation and tutorials lack the depth you’d find from larger vendors. When you hit an edge case at 3 AM, Stack Overflow won’t have your answer.
Best for: Teams that have already committed to OpenTelemetry instrumentation and want the cheapest, most native backend for OTel data.
Comparison Table
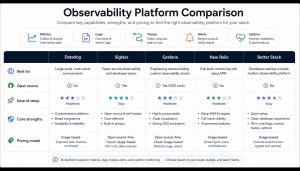
| Tool | Logs + Metrics + Traces | Free Tier | Self-Host Option | OTel Native | Pricing Model | Standout Feature |
|---|---|---|---|---|---|---|
| Grafana Cloud | Yes (separate backends) | 10K series, 50 GB logs, 50 GB traces | Yes (OSS stack) | Yes | Per-signal usage | Ecosystem and community size |
| Better Stack | Logs + Uptime (limited metrics) | Limited | No | Partial | Per-seat + usage | Integrated incident management |
| SigNoz | Yes (unified) | Community edition | Yes | Yes | Per-volume or self-host free | Full-stack open source |
| Axiom | Logs + Traces (metrics limited) | 500 GB/month ingest | No | Yes | Per-ingest, retention free | Unlimited data retention |
| Uptrace | Yes (unified) | Community edition | Yes | Yes (built for it) | Per-volume | Deepest OTel integration |
The Decision Framework
Choosing comes down to three questions.
Question one: Do you have ops capacity to self-host? If yes, SigNoz self-hosted gives you maximum value per dollar. You’ll spend time instead of money, but for a team with infrastructure skills, that trade works.
Question two: What’s your primary signal? If logs dominate your workflow and you need long retention, Axiom wins on economics. If you care most about developer experience and fast incident response, Better Stack is hard to beat. If you need all three signals with deep correlation, Grafana Cloud or SigNoz are your realistic options.
Question three: How invested are you in OpenTelemetry already? If your services already export OTLP, Uptrace offers the lowest-friction, lowest-cost backend. If you’re starting fresh, Grafana Cloud’s free tier lets you experiment without commitment.
For teams that really don’t know where to start: spin up Grafana Cloud’s free tier this afternoon. It costs nothing, covers all three signals, and gives you a baseline to compare against. You can always switch later because OpenTelemetry makes the backend interchangeable.
Migration Playbook: Four Steps, Two Weeks
The migration itself is simpler than most teams expect. Four steps, roughly two weeks for a 10-person engineering org.
Step one is deploying an OpenTelemetry Collector as your single data export point. This is the move that makes everything else easy. Regardless of which backend you choose, your application instrumentation stays the same. Changing backends later means editing one Collector config file, not re-instrumenting your code.
Step two is migrating logs first. Logs are the easiest signal to validate because you can compare outputs side-by-side. Run the new tool in parallel with your current setup and confirm that the same errors appear in both places.
Step three is bringing over traces, then metrics. Traces are slightly harder to validate but follow the same parallel-run approach. Metrics come last because they often have the most established alert rules that need careful recreation.
Step four is cutting over. Shut down the old system, update your team’s bookmarks, and point your on-call runbooks at the new dashboards.
The critical insight: if you standardize on OpenTelemetry first, switching backends becomes a configuration change rather than a re-instrumentation project. That’s the real unlock. Your investment in instrumentation survives regardless of which vendor you pick today.
The Bottom Line
Datadog earned its market position with an excellent product. But the pricing model punishes small teams who grow. Every new host, every new integration, every custom metric adds to a bill that compounds faster than your revenue.
The five alternatives above each solve this problem differently. None of them are perfect. Grafana Cloud is powerful but complex. Better Stack is beautiful but limited on metrics. SigNoz is cheap but requires ops investment. Axiom is great for logs but weak on traces. Uptrace is OTel-native but young.
Pick the one that matches your team’s actual constraints, not the one with the best landing page. Deploy OTel Collector first regardless. And remember that the switching cost drops to near zero once your instrumentation layer is standardized.
Your $8,200 monthly bill is not inevitable. It’s a choice.
Related Reading
- 5 Observability Tools That Wont Charge You 8000 Per Month
- Observability on a Startup Budget: 5 Datadog Alternatives That Actually Work in 2026
Stay updated with our latest AI insights