Your Datadog bill just hit $8,200 this month. Nobody approved that. It crept up because someone added a few custom metrics with high-cardinality labels, APM is running at $31 per host, and suddenly you’re spending 15% of your engineering salary budget on observability alone.
For a 50-host setup with full-stack monitoring (logs, metrics, traces, APM), Datadog easily runs $27,000 a year. At a Series A or B startup burning through runway, that’s a senior engineer’s salary going to dashboards.
You don’t need to accept this. The observability tooling market has shifted dramatically since 2024, and there are now legitimate alternatives that give you correlated logs, metrics, and traces without the sticker shock.
Why This Matters Now: OpenTelemetry Changed Everything
The reason you can swap observability vendors in 2026 without a six-month migration project comes down to one thing: OpenTelemetry won.
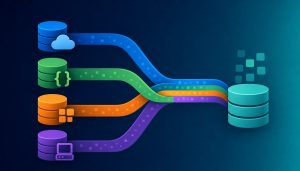
OTLP (OpenTelemetry Protocol) is now the HTTP of telemetry data. Every major observability tool speaks it natively. Your instrumentation is no longer locked to your vendor. Deploy the OTel Collector as your telemetry pipeline, and you can route data to any backend, split traffic between vendors for evaluation, or switch providers in an afternoon.
This also means the three-signal correlation problem (connecting a log line to a trace span to a metric spike) is solved at the protocol level. You don’t need a single vendor to own all three signals anymore. But the tools that do handle all three in one place still offer the fastest time-to-insight when you’re a small team without a dedicated platform engineering group.
The 5 Alternatives, Evaluated for Small Teams
I evaluated these tools against what actually matters for a 10-50 person engineering org: total cost at realistic volumes, time to first dashboard, OpenTelemetry support, and whether you need a dedicated person to keep the thing running.
1. Grafana Cloud
Best for: Teams that want ecosystem flexibility and a generous free tier
Grafana Cloud gives you 10,000 active metric series, 50GB of logs, and 50GB of traces for free. That’s not a 14-day trial. That’s the permanent free tier.
The strength here is the ecosystem. You get Prometheus for metrics, Loki for logs, Tempo for traces, and the Grafana dashboard layer tying it all together. If your team already knows PromQL, the learning curve is minimal.
The tradeoff: Grafana Cloud is a platform you assemble, not a product you turn on. You’ll spend time configuring data sources, building dashboards, and wiring up alerting rules. For teams with some platform engineering capacity, this flexibility is a feature. For a 5-person backend team shipping product, it’s overhead.
Cost at scale: Once you exceed the free tier, pricing is usage-based. A 50-host setup with moderate log volume runs $400-800/month depending on cardinality and retention needs. Still 50-70% less than equivalent Datadog.
2. Better Stack
Best for: Teams that value developer experience above all else
Better Stack took the opposite approach from Grafana. Instead of assembling components, you get a single product where logs, uptime monitoring, status pages, and on-call rotation all live together.
The backend runs on ClickHouse, which means log queries are fast even at high volume. The UI is opinionated in the right ways: structured log search works out of the box, and the status page feature means one fewer SaaS tool on your bill.
Starting at $24/month, the entry point is low. The DX focus shows in small touches: live tail that actually works, SQL-based querying for power users, and alerting that doesn’t require a PhD in configuration.
Where it falls short: The metrics story is newer and less mature than their logging. If you need deep custom metrics with high-cardinality dimensions, you may outgrow it. Trace support exists but isn’t as developed as dedicated APM tools.
3. SigNoz
Best for: Teams that want full ownership of their observability data
SigNoz is the only open-source project that handles logs, metrics, and traces in a single codebase. It’s built on ClickHouse for storage, which gives you excellent query performance without the operational headaches of managing multiple backends.
You can self-host it (the Docker Compose setup takes about 20 minutes) or use their managed cloud offering. Self-hosted means your telemetry data never leaves your infrastructure, which matters if you’re in fintech, healthcare, or any regulated space.
The pricing math is straightforward: SigNoz Cloud runs 60-80% cheaper than Datadog at equivalent volumes. Self-hosted costs you compute and storage, but at 50 hosts you’re looking at a single 8-core node for the SigNoz backend.
The catch: Self-hosting means you own uptime and upgrades. Their managed cloud removes this burden, but the team is smaller than Grafana Labs or Datadog. Support response times reflect that reality.
4. Axiom
Best for: Teams that want unlimited retention without managing storage tiers
Axiom’s architecture is serverless and built for append-only event data. The standout feature: no retention limits. Your data stays queryable forever without tiering into cold storage that takes minutes to search.
The free tier gives you 500GB per month of ingest, which is generous enough for most startups through Series B. The query language (APL, similar to Kusto/KQL) is powerful but different from what most teams know. Budget a few days of learning curve.
Axiom handles logs and events natively. Metrics support works through the events model (you query aggregations over event streams rather than storing pre-computed series). Trace support exists via OpenTelemetry ingest.
Worth knowing: The “unlimited retention” model means you pay for ingest volume, not storage duration. If you have high-volume, low-value logs (debug output, health checks), you’ll want to filter at the collector level or costs scale linearly with volume.
5. Uptrace
Best for: Teams going all-in on OpenTelemetry
Uptrace is built from the ground up for OTLP data. There’s no legacy agent format, no proprietary instrumentation library. You send OpenTelemetry data, Uptrace stores and visualizes it.
Pricing runs 5-10x cheaper than Datadog at equivalent volumes. For a 50-host setup, expect $200-500/month for full logs, metrics, and traces.
The UI is functional rather than polished. You won’t get the same dashboard-building experience as Grafana, but for teams that primarily interact with observability through alerts and on-demand investigation, it covers the workflow.
Tradeoff: Smaller community and ecosystem. Fewer pre-built dashboards, fewer integrations, fewer blog posts solving your exact problem. You’re trading ecosystem maturity for cost savings and protocol purity.
Decision Framework
| Scenario | Recommended Tool | Reason |
|---|---|---|
| Pre-revenue / seed stage, need free monitoring | Grafana Cloud | 10K series + 50GB logs free, no credit card |
| Small team, want fastest setup + on-call built in | Better Stack | Single product, sub-hour setup, status page included |
| Regulated industry, data must stay on-prem | SigNoz (self-hosted) | Only real open-source option with all three signals |
| High log volume, need long retention | Axiom | Unlimited retention, 500GB/mo free ingest |
| Pure OTel shop, cost is primary driver | Uptrace | 5-10x cheaper than Datadog, zero vendor lock-in |
| 50+ hosts, need Datadog-level depth on budget | SigNoz Cloud | 60-80% savings, closest feature parity |
| Already using Prometheus + Grafana OSS | Grafana Cloud | Natural upgrade path, keep existing dashboards |
| Want to evaluate before committing | Any of these | All support OTLP, try two in parallel via OTel Collector |
How to Migrate Without Breaking Production
The migration from Datadog (or any existing tool) follows a pattern that minimizes risk:
Phase 0: Deploy the OTel Collector (Week 1)
Install the OpenTelemetry Collector as a sidecar or daemon on your infrastructure. Configure it to forward data to your existing Datadog setup. Nothing changes yet, but you now have a vendor-neutral pipeline in place.
Phase 1: Migrate Logs First (Weeks 2-3)
Logs are the safest signal to migrate because they’re the least coupled to alerting. Add your new backend as a second exporter in the Collector config. Run both in parallel for a week. Validate that queries return the same results, then cut Datadog log ingest.
Phase 2: Migrate Traces (Weeks 3-4)
Traces are the next lowest-risk signal. Most teams use traces for debugging, not alerting, so a gap during migration won’t page anyone. Same parallel-run pattern: dual-export, validate, cut over.
Phase 3: Migrate Metrics Last (Weeks 4-6)
Metrics are the hardest because they’re tied to alerts and SLOs. Convert alert rules to the new platform first. Run both systems in parallel for at least two weeks. Only cut Datadog metrics once you’ve confirmed alert parity.
The whole migration takes 4-6 weeks for a 50-host setup. You can do it faster if you’re less careful, but the parallel-run approach means zero observability gaps during the transition.
The Bottom Line
Datadog is a great product. It’s also priced for enterprises with dedicated platform teams and seven-figure observability budgets. If you’re a startup trying to ship product while keeping costs rational, you have options now that didn’t exist two years ago.
The unlock is OpenTelemetry. Once your instrumentation speaks OTLP, you’re free to pick the backend that matches your budget and team size. Start with the OTel Collector, pick one tool from this list, and redirect that $27K annual spend toward someone who writes code instead of watching dashboards.
Related Reading
- 5 Observability Tools That Wont Charge You 8000 Per Month
- Your Datadog Bill Just Hit $8,200. Now What?
Stay updated with our latest AI insights