The $18,000 Question Every SRE Team Faces
Your CFO walks into the weekly engineering sync with a printout of last month’s Datadog bill. It’s jumped from $8,000 to $14,000 in three months. She wants to know why observability costs more than your entire AWS compute budget.
You explain that the team launched 80 new microservices last quarter. Each one needs monitoring. Datadog charges per container, per custom metric, per host. The infrastructure scaled, the bill scaled with it.
She asks if there’s an alternative. You mention Grafana Cloud. She asks how much cheaper. You hesitate, then say maybe 10x.
This conversation happens in hundreds of engineering teams every month. The observability platform decision sits at the intersection of three forces: how fast can we debug production issues, how much will it cost, and can the team actually use it.
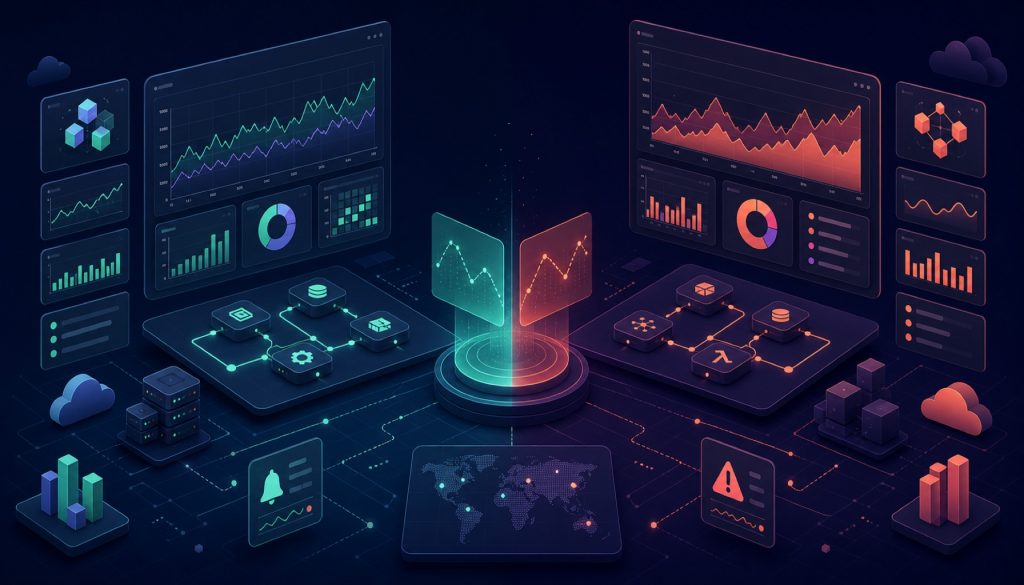
Datadog and Grafana Cloud represent opposite ends of the spectrum in 2026. One is a commercial all-in-one suite built for convenience. The other is a managed version of open-source tools built for cost efficiency. The wrong choice costs you either money or time, sometimes both.
Datadog: The Convenience Tax Is Real
Datadog’s core value proposition is simplicity. Install an agent, wait five minutes, and you have dashboards showing CPU, memory, network, application traces, and error rates. No configuration files, no understanding of data models, no reading documentation for hours.
The product covers the full observability stack: APM, logs, metrics, distributed tracing, real user monitoring, synthetic monitoring, security monitoring. The integrations are deep. AWS services auto-discover and start reporting metrics. Kubernetes clusters map themselves into service dependency graphs. Language SDKs auto-instrument your code without touching a single line.
This convenience comes with a price structure that scales linearly with your infrastructure. A 50-person engineering team running 100 containers and tracking 500 custom metrics will see monthly bills around $5,000. Double the containers, double the bill. For fast-growing SaaS companies, this becomes a hidden tax on growth.
The second cost is vendor lock-in. Your query language, alert rules, dashboard definitions, and custom integrations all use Datadog-specific formats. Moving to another platform means rewriting everything. Teams that commit to Datadog find themselves committed for years, regardless of whether the pricing still makes sense.
Datadog works best for teams with three characteristics. First, budget availability. Companies with $10M+ annual revenue can absorb $5k-$20k monthly observability costs without breaking the financial model. Second, urgency over optimization. Teams that need to ship fast and fix production issues faster value the time saved over the money spent. Third, limited platform engineering capacity. Smaller teams without dedicated observability engineers need something that works out of the box.
Datadog works poorly for early-stage startups burning through runway, companies with rapid infrastructure growth where costs spiral out of control, and teams that prioritize data sovereignty and open ecosystems over commercial convenience.
Grafana Cloud: The Open Source Bet With a Learning Curve
Grafana Cloud takes the open-source observability stack (Grafana for visualization, Prometheus for metrics, Loki for logs, Tempo for traces) and runs it as a managed service. The underlying tools are industry standards. The data models are portable. The query languages are open.
The pricing model is fundamentally different. Instead of charging per host or container, Grafana Cloud charges per metric series and log volume. If your application emits metrics efficiently, costs can run 5-10x lower than Datadog. A team spending $5,000 monthly on Datadog might spend $500 on Grafana Cloud for equivalent coverage.
The free tier is generous: 10,000 metric series, 50GB logs, 50GB traces. Small teams can run production workloads without paying anything. When you do pay, the cost curve is more predictable. Adding containers doesn’t automatically increase costs if those containers emit the same types of metrics.
The tradeoff is complexity. Grafana Cloud expects you to understand Prometheus metric types, PromQL query syntax, Loki label design, and Tempo sampling strategies. If nobody on your team knows these concepts, the onboarding period stretches from days to weeks. What takes five minutes in Datadog takes two days in Grafana Cloud.
The integration ecosystem is less polished. Datadog auto-discovers AWS resources and configures monitoring automatically. Grafana Cloud requires you to deploy Prometheus exporters, configure scrape targets, and design label schemas manually. Kubernetes monitoring needs the Prometheus Operator plus the Grafana Agent, not a single Helm chart.
Grafana Cloud fits teams with budget constraints (early-stage startups, open-source projects, non-profits), existing Prometheus knowledge (teams already running self-hosted Prometheus find migration straightforward), concern about vendor lock-in (open formats mean you can switch providers without rewriting everything), and rapid infrastructure growth where predictable costs matter more than setup speed.
Grafana Cloud struggles with teams that lack Prometheus expertise (the learning curve is steep), need immediate results (configuration takes time), or require mature APM capabilities (Tempo works but doesn’t match Datadog’s code-level profiling and flame graphs).
Feature Comparison: Datadog Leads, Grafana Covers the Essentials
APM tells the clearest story. Datadog provides distributed tracing with automatic instrumentation, flame graphs showing exactly which function calls consume CPU time, and service dependency maps that update in real-time. Grafana Cloud’s Tempo provides distributed tracing but requires manual SDK configuration and lacks the deep code-level profiling that Datadog surfaces.
Log management shows similar patterns. Datadog offers powerful full-text search, live tail, log-to-metrics transformation, and log pattern detection. Loki in Grafana Cloud queries logs quickly using label indexes but trades off full-text search capability for performance. If you need to grep through logs for arbitrary strings, Loki requires more careful label design upfront.
For core metrics monitoring, the platforms converge. Datadog’s custom metrics and aggregation functions work well. Prometheus in Grafana Cloud offers PromQL, which is more powerful but harder to learn. Both handle standard monitoring tasks (CPU, memory, request rates, error rates) equally well.
Distributed tracing again favors Datadog. Automatic trace injection means you don’t touch application code. Service maps appear automatically. Grafana Cloud’s Tempo requires OpenTelemetry SDK integration and manual configuration, though the cost per span is significantly lower.
Alerting reaches rough parity. Datadog provides flexible alert rules, multi-channel notifications, and anomaly detection algorithms. Grafana Cloud uses Alertmanager, which is powerful but requires YAML configuration and deeper understanding of routing trees and inhibition rules.
Dashboards favor Grafana. The Grafana visualization engine is the industry standard. Flexibility, customization, and plugin ecosystem exceed what Datadog offers. Datadog provides drag-and-drop dashboard editing and more pre-built templates, but Grafana dashboards can be infinitely customized.
Real user monitoring and synthetic monitoring heavily favor Datadog. Datadog RUM includes session replay, performance monitoring, and error tracking for frontend applications. Grafana Cloud’s Faro provides basic RUM but lacks maturity. Synthetic monitoring exists in both but Datadog’s browser tests and API checks are more comprehensive.
Integration ecosystem goes to Datadog. Over 500 pre-built integrations cover cloud providers, databases, message queues, CI/CD tools, and collaboration platforms. Grafana Cloud relies on community-built Prometheus exporters, which cover most use cases but require more manual setup.
Pricing: The 10x Cost Difference Is Real
Consider a typical SaaS application architecture at three growth stages.
A 10-person team in the early stage runs 20 containers, tracks 100 custom metrics, and generates 10GB of logs monthly. Datadog Pro costs around $500 monthly. Grafana Cloud’s free tier covers this entirely. The cost difference: $500 monthly or $6,000 annually.
A 50-person team in growth stage runs 100 containers, tracks 500 custom metrics, and generates 100GB of logs monthly. Datadog Pro with APM costs around $5,000 monthly. Grafana Cloud Pro costs around $500 monthly. The cost difference: $4,500 monthly or $54,000 annually.
A 200-person team at scale runs 500 containers, tracks 2,000 custom metrics, and generates 500GB of logs monthly. Datadog Enterprise costs around $20,000 monthly. Grafana Cloud Advanced costs around $2,000 monthly. The cost difference: $18,000 monthly or $216,000 annually.
The pattern holds across all scales. Grafana Cloud consistently costs one-tenth of Datadog for equivalent infrastructure coverage. The gap widens as infrastructure grows because Datadog’s per-container and per-host pricing scales linearly while Grafana Cloud’s per-metric pricing scales more slowly if you design metrics carefully.
Datadog’s pricing model punishes growth. When you scale from 100 containers to 200, your bill doubles even if those new containers serve the same application. Grafana Cloud’s cost curve is flatter. Adding containers that emit the same metric types increases costs marginally, not proportionally.
Integration Maturity: Automation vs Flexibility
AWS integration shows the difference clearly. In Datadog, you click a button, grant IAM permissions, and every EC2 instance, RDS database, Lambda function, and load balancer starts reporting metrics automatically. In Grafana Cloud, you deploy a CloudWatch exporter or configure Prometheus to scrape CloudWatch APIs, write configuration files specifying which metrics to collect, and debug label mappings when dashboards break.
Kubernetes follows the same pattern. Datadog provides a Helm chart that deploys an agent as a DaemonSet, automatically discovers all pods, services, and deployments, and starts populating service maps within minutes. Grafana Cloud requires deploying the Prometheus Operator, configuring ServiceMonitor resources, installing the Grafana Agent, and ensuring label consistency across the stack.
Language SDK maturity varies by platform. Datadog maintains official SDKs for Java, Python, Go, Node.js, Ruby, and PHP with automatic instrumentation that requires minimal code changes. Grafana Cloud relies on OpenTelemetry SDKs, which are standardized but require explicit instrumentation and configuration for each service.
Third-party service integrations favor Datadog. Over 500 built-in integrations cover Slack, PagerDuty, Jira, GitHub, and most SaaS tools engineering teams use daily. Grafana Cloud depends on its plugin ecosystem, which is extensive but less comprehensive and sometimes requires community-maintained plugins of varying quality.
The tradeoff is flexibility. Datadog’s automated integrations work great when they match your use case but become limiting when you need custom behavior. Grafana Cloud’s manual configuration requires more upfront work but gives you complete control over metric collection, label design, and data retention policies.
Decision Framework: Match Platform to Team Reality
Choose Datadog when budget allows for $5k-$20k monthly spend and the business operates at $10M+ annual revenue where observability costs represent reasonable infrastructure investment. Choose Datadog when time-to-value matters more than cost optimization and production issues need resolution in minutes, not hours. Choose Datadog when deep APM is non-negotiable and you need code-level profiling, flame graphs, and automatic service dependency mapping. Choose Datadog when frontend monitoring and synthetic testing are core requirements and real user monitoring with session replay provides critical debugging context. Choose Datadog when the team lacks Prometheus expertise and the learning curve cost exceeds the price premium.
Choose Grafana Cloud when budget constraints are real and every dollar matters for runway, profitability, or non-profit operations. Choose Grafana Cloud when infrastructure grows rapidly and predictable costs matter more than initial setup speed. Choose Grafana Cloud when the team already uses Prometheus or employs engineers familiar with the open-source observability stack. Choose Grafana Cloud when vendor lock-in concerns outweigh convenience and data portability and open formats provide strategic value. Choose Grafana Cloud when core needs are metrics and logs and advanced APM and RUM are nice-to-have rather than must-have.
A hybrid approach makes sense for specific situations. Use Grafana Cloud for metrics and logs where cost scales well. Add Datadog APM for application performance monitoring where functionality matters most. Total cost runs 50% below full Datadog but adds operational complexity managing two platforms.
The Bottom Line: Start Cheap, Upgrade When It Makes Sense
Most teams should start with Grafana Cloud. The free tier supports early-stage production workloads. Paid plans remain affordable as you scale. The open-source foundation means you’re never locked in. If the team grows to 100+ engineers, the budget expands to match, and APM becomes critical, migrate to Datadog then.
Datadog is excellent software. It solves real problems elegantly. But not every team needs to pay 10x for that elegance. The question is not whether Datadog is better. The question is whether it’s 10x better for your specific situation.
For teams with tight budgets, rapid growth, or existing Prometheus knowledge, the answer is no. Grafana Cloud delivers 80% of the value at 10% of the cost. That math works for most companies.
For teams with budget headroom, urgent production issues, and limited platform engineering capacity, the answer might be yes. The time saved debugging outages and the mental overhead avoided managing complex configurations can justify the premium.
The worst decision is defaulting to Datadog because it’s popular without evaluating whether your team actually needs what it offers. Run the numbers. Calculate what you’ll spend at 2x current scale, then 5x. If the projection makes your CFO uncomfortable, you have your answer.
Stay updated with our latest AI insights