Sarah stared at the invoice. Datadog billed her team $8,200 this month. The culprit: a developer tagged pod names as metric labels on their Kubernetes cluster, creating 47,000 high-cardinality time series at $0.05 each.
At 2:30 AM, the production API timed out. She needed distributed tracing to debug it, but the Datadog APM trial had expired. The quote for full access: $31/host/month across 22 servers. Another $682 on top of an already painful bill.
This happens every week at Series A startups. Datadog is a good product. But for teams of 10-50 engineers, the pricing only goes up. A full-stack observability setup across 50 hosts easily hits $27,000/year. That’s 15% of a small engineering team’s salary budget spent on watching the systems run.
What small teams actually need in 2026
Back in 2020, you could get by with Prometheus plus a Grafana dashboard and maybe ELK for logs. That era is over.
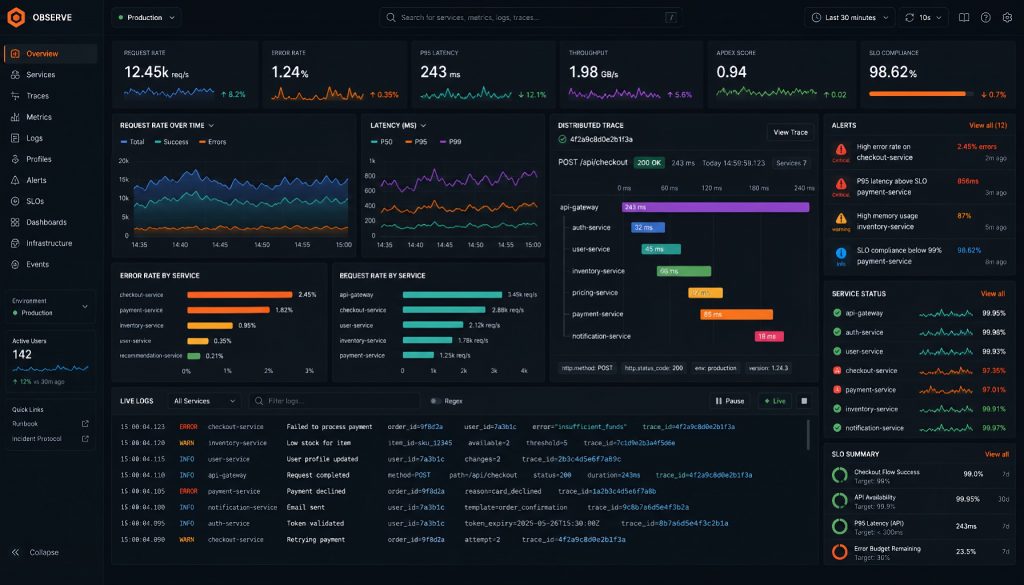
Modern observability means three-signal correlation: logs, metrics, and traces working together. Not picking one or two. You need to jump from a CPU spike (metric) to the request trace that caused it, then pull up the error log that explains why. That correlation is the actual value. Individual signals in isolation are just noise with extra steps.
OpenTelemetry has become the default standard. OTLP is the HTTP of telemetry. If a tool doesn’t support OpenTelemetry in 2026, that’s a red flag. The era of vendor lock-in through proprietary agents is done.
With that context, here are five alternatives worth evaluating. Each fills a different niche, and the right pick depends on your team’s size, ops maturity, and what you care about most.
Grafana Cloud: the free tier that actually works
Grafana Labs spent a decade building the best open-source visualization layer, then wrapped managed backends around it. Grafana Cloud gives you Prometheus for metrics, Loki for logs, Tempo for traces, and the familiar Grafana UI on top. All managed.
The free tier is surprisingly usable for small production deployments: 10,000 active metric series, 50 GB logs, 50 GB traces, 14-day retention. Three users, no credit card required.
Where it shines: the ecosystem is unmatched. You’ve probably already used Grafana dashboards at a previous job. Open-source foundations mean no lock-in. Scaling pricing is transparent and predictable.
Where it hurts: configuration complexity runs higher than pure-SaaS competitors. Multiple backend components mean a steeper learning curve. Alert rules end up scattered across Mimir, Loki, and Tempo rather than living in one place.
Better Stack: best developer experience in the category
Better Stack combines uptime monitoring, log management, and incident management into a single product. The interface feels like Linear built an observability tool.
The core pitch: log search is extremely fast (ClickHouse under the hood), built-in status pages, and alerting flows directly into on-call scheduling and incident response. One product handles the full loop from detection to resolution.
The free tier is limited but lets you experience the complete workflow. Paid plans start at $24/month.
Good fit for teams that care about developer experience and don’t want to assemble their own on-call stack. Bad fit if you need complex custom metrics with PromQL queries or want deep infrastructure-level observability.
SigNoz: open-source full-stack, self-host to save
SigNoz is the only project that puts logs, metrics, and traces into a single open-source codebase. It runs on ClickHouse, so query performance holds up well under load.
Self-hosting means you only pay for compute. No feature gates, no per-seat licensing. For teams with ops capability, this is the cheapest path to full observability by a wide margin.
If you don’t want to manage infrastructure, SigNoz Cloud starts at 60-80% less than equivalent Datadog pricing.
The tradeoffs: smaller community than Grafana’s ecosystem, fewer plugins and integrations, and enterprise features like SSO and RBAC sit behind the paid tier.
Axiom: unlimited retention on a serverless architecture
Axiom’s differentiator is data retention without time-based pricing. Most competitors charge more for longer retention windows. Axiom doesn’t. The architecture is serverless, so there’s no per-host billing either.
This makes it a strong pick for teams with high log volume but infrequent queries, or anyone who needs long-term archives for compliance and audit purposes.
The free tier offers 500 GB ingest per month with 30-day retention, which covers most small teams comfortably.
The gaps: tracing capabilities are weaker than dedicated tracing tools, metrics support doesn’t match the Prometheus ecosystem’s depth, and third-party integrations are still catching up.
Uptrace: built for OpenTelemetry from day one
Uptrace was designed around OpenTelemetry from the start. No proprietary agents, no custom SDKs. If your team has already invested in OTel instrumentation, onboarding is just pointing your collector at a new endpoint.
Pricing is volume-based and transparent. Typical costs run 5-10x cheaper than Datadog for equivalent data volumes.
The downsides are predictable for a smaller vendor: lower brand recognition, smaller community, and documentation that doesn’t match the depth you’d find from Grafana or Datadog’s technical writing teams.
Decision framework
| Scenario | Recommendation | Why |
|---|---|---|
| Already running Prometheus/Grafana | Grafana Cloud | Direct migration path, ecosystem continuity |
| Developer experience is top priority | Better Stack | Best UI, fastest time-to-value |
| Have ops capacity, want lowest cost | SigNoz self-hosted | Only pay for compute |
| High log volume, need long retention | Axiom | Retention doesn’t increase cost |
| Fully committed to OpenTelemetry | Uptrace | Native OTel, zero friction |
| Not sure yet | Grafana Cloud free tier | Zero-cost experimentation |
How to actually migrate
The migration itself isn’t the hard part. The hard part is deciding to do it. Once you commit, here’s the sequence that works:
Start with OpenTelemetry Collector. Deploy it as your unified data export layer. Regardless of which backend you pick, your instrumentation only gets configured once. If you switch tools six months later, you change one endpoint URL. That’s it.
Migrate logs first. They’re the easiest signal to validate. You can compare output side-by-side with your existing tool and confirm nothing is getting dropped. Move traces next, then metrics last. Metrics migrations carry the most risk because alerting rules depend on them.
Run parallel for two weeks. Keep your old system active while the new one ingests the same data. Compare alert accuracy, query speed, and coverage. This is where you catch gaps before they become 3 AM surprises.
Cut over and notify. Turn off the old system, update your team’s bookmarks, and move on.
For a 10-person team, the whole process takes one to two weeks. The timeline isn’t about tool complexity. It’s about whether you standardized your data pipeline with OTel beforehand. If you did, switching backends is a configuration change. If you didn’t, you’re instrumenting services and migrating simultaneously, which is harder but still manageable.
Common mistakes during migration
Having watched several teams go through this process, a few patterns consistently trip people up.
The first is migrating alerting rules last. Teams move their data to a new backend but leave alerts pointing at the old system for “safety.” Then someone forgets to duplicate a critical alert, and the old system gets decommissioned with live alerts still attached. Migrate your most important alerts within the first week of parallel running. Don’t wait until cutover day.
The second is underestimating cardinality budgets. If high-cardinality labels caused your Datadog bill to spike, the same labels will cause problems on any metrics backend. Moving to Grafana Cloud doesn’t fix a cardinality problem. It just makes it cheaper to store. You still need label hygiene. Fix the instrumentation before or during migration, not after.
The third is ignoring team adoption. The best observability platform is the one your engineers actually open when something breaks. If you pick a technically superior tool that nobody uses because the query language is unfamiliar or the UI feels hostile, you’ve wasted the migration effort. Get buy-in from on-call engineers before committing. Let them run queries during the parallel-run phase. Their feedback matters more than any feature comparison.
Cost comparison at realistic scale
Here’s what these tools actually cost for a typical 20-person engineering team running 30 hosts, producing roughly 100 GB of logs and 50,000 active metric series per month:
| Tool | Estimated monthly cost | Notes |
|---|---|---|
| Datadog | $2,800-4,500 | Infrastructure + APM + Logs |
| Grafana Cloud | $400-800 | Pay-as-you-go beyond free tier |
| Better Stack | $200-500 | Depends on log volume |
| SigNoz self-hosted | $150-300 | Cloud compute only |
| SigNoz Cloud | $500-900 | Managed, volume-based |
| Axiom | $200-400 | Ingest-based, no per-host |
| Uptrace | $300-600 | Volume-based |
These are rough estimates based on published pricing pages and community reports. Your actual costs will vary based on retention periods, query frequency, and how aggressively you’ve controlled cardinality. But the magnitude of difference is consistent: 3-10x cheaper than Datadog across every alternative.
The question is never “can we afford to switch?” It’s “can we afford the two weeks of engineering time to do the migration?” For most teams, the payback period is under a month.
The bottom line
Datadog’s pricing model works great for Datadog. For a 15-person startup burning through Series A funding, spending $27,000/year on observability when five solid alternatives exist at a fraction of the cost doesn’t make financial sense.
The tools listed here all support OpenTelemetry. They all handle the three core signals. The differences come down to operational preferences: do you want managed simplicity, maximum cost savings, the best UI, or the deepest ecosystem?
Pick one. Deploy OTel Collector first. Migrate in stages. You’ll have full observability running inside two weeks, and your monthly bill will drop by 60-90%. That freed-up budget is better spent on the engineers who build the product your customers actually pay for.
Related Reading
- Observability on a Startup Budget: 5 Datadog Alternatives That Actually Work in 2026
- Your Datadog Bill Just Hit $8,200. Now What?
Stay updated with our latest AI insights